


Mahkameh Ghanei and Francesco Guidi
Background
According to UK Government’s data, the attainment gaps for undergraduate degree classification in the UK by ethnicity & gender still shows biased towards black and ethnic minority groups. Studies highlighting these differences due to various factors including ethnicity (Richardson, 2018; Arday & Mirza 2018). In recent years number of solutions have been put forward by developing innovative pedagogy such as Team-Based Learning (TBL) (Cagliesi & Ghanei, 2021).
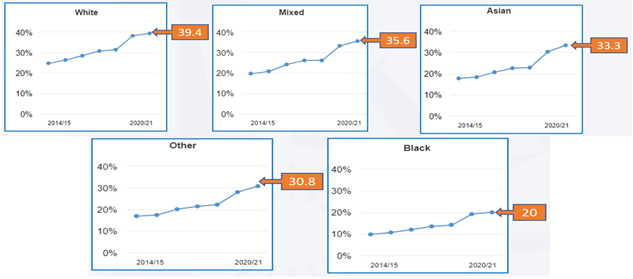
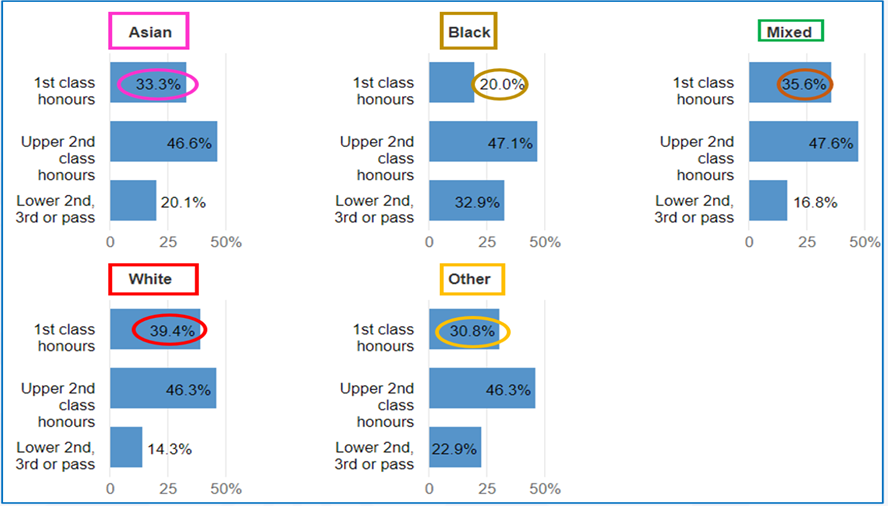
As we can see in figure 1, during academic year 2020-21, the best performed group of students were Whites as 39.4% of the obtained first class degree, and the Blacks with 20% were the lowest group achieving first class degree. In addition, the Black students scored higher level of lower second- and third-degree classifications (32.9%).
Figure 1: Percentage of Graduates within each Ethnic Group Achieving the different Degree Classifications

Figure 2 shows a general increase in number of first-class degrees awarded during the academic years of 2012-13 and 2020-21. However, after the academic year 2018-19 there was a massive increase in percentage of first-class degree awarded; among all the ethnic groups Black students had the lowest percentage of increase.
Figure 2: Percentage of Graduates within each group who got first class degree over time (UK Gov. 2020-21)
Value-Added (VA)
Attainment gap can be better explained and understood by using University Kingston’s Value-Added (VA) score which is designed to measure these gaps at university, faculty, and module levels (more detailed information can be found at Advance HE 2023 website).
- Value-Added (VA) definition
Values Added (VA) Score is calculated by taking the “actual” degree outcomes for all domiciled graduates across the UK for the last five years. Calculating the probability that a given student achieve a 1st/2:1 degree. Aggregating these probabilities produces an “expected” percentage for any given cohort who should achieve 1st/2:1 degree.
- Value-Added (VA) Equation/formula

If a student’s actual score is the same as expected score, then the VA-score is 1.0. However, if VA score is higher than 1, it implies that student’s actual score is above his/her expected one which can show that students may have lower expectations. Conversely, when VA score is lower than 1.0, can mean that student’s expectation falls below his/her actual performance.
- University of Greenwich (UoG) level vs Business Faculty Value Added (VA) Scores:
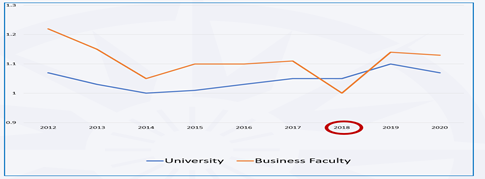
Figure 3 shows UoG’s Value-Added (VA) scores during the period of this investigation. There is a noticeable gap between University and Business Faculty’s scores. Apart from 2018-19, Business Faculty’s VA scores is way above University level. This could possibly be explained by University’s recruitment policy due to removal of Government’s Cap in academic year 2015-16, which impacted the VA scores of this cohort when graduating in 2018-19. We are continuing with our research both at qualitative and quantitative levels to ascertain the main factors contributing to this gap.
Figure 3: Value-Added (VA) scores at University and Business Faculty at Greenwich University
- Departmental-level VA scores
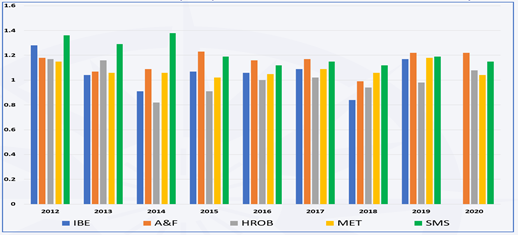
Looking at the breakdown of VA scores at Departmental levels shows that academic year 2012 has the highest VA score for all Departments, and the lowest scores are in academic year 2018. These could be attributed to both internal (i.e., Business Faculty’s recruitment, assessment, and algorithm for calculating degree classification policies) and external factors (i.e., removal of Caps). Further in-depth investigation is required to explain these differences.
Figure 4: Value-Added Scores at Departmental Levels (UoG)
Value-Added Scores by Gender and Ethnicity
By looking at White and BAME students, VA scores show interesting differences at university as well as departmental level as highlighted below.
(a) University level
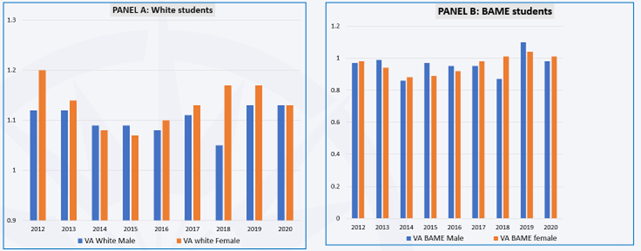
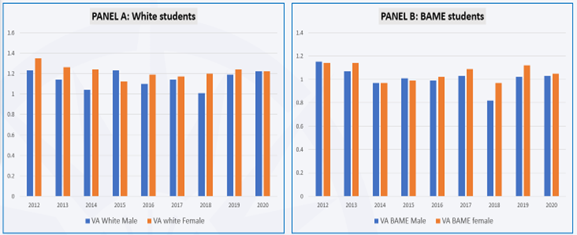
In Figure 5 Panel A, we observe that the VA scores for White students was consistently above 1.0 over entire period. Conversely, for BAME students (i.e., Panel B) only in 2019 the VA scores was above 1.0. Secondly, as shown in Panel A, there were more fluctuations in VA scores for Whites students and, in general, male students lagged behind females. Whereas in BAME students (i.e., Panel B) there was more consistency in VA scores and gap between male and female was negligible.
Figure 5: Value-Added (VA) Scores at University Level: by Ethnicity & Gender
(b) Business Faculty level
By looking at Figure 6 Panel A, we observe that the VA score for White students did not decline below 1.0 over entire period. Conversely, for BAME students (i.e., Panel B) there were periods when VA scores were below 1.0 (i.e., 2014 and 2018). For Panel A, we found that VA scores for White female students for the first four years of investigation were declining. The common aspect in both Panels was that females VA scores were higher than males over the entire period of analysis.
Figure 6: Value-Added (VA) scores at Business Faculty Level: by Gender & Ethnicity
Empirical Analysis: Preliminary Results
We were interested in examining the determinants of VA score by looking at internal and external factors. By using econometrics methodologies, we tried to quantify the effect of these factors on VA scores as departmental levels. The outline of our analysis is presented via the following points:
(a) Dependent Variable:
- Value-Added (VA) Scores by 5 Departments (A&F; HROB, IBE, MET, & SMS)
(b) Independent Variables:
- Gross Domestic Product (GDP) growth
- Gross Domestic Product (GDP) per capita
- Total government expenditure on education (% of gov. expenditure)
(c) Dummy variables:
- Step marking (Internal Factor: Change in University’s assessment Policy) – 2020
- Removal of recruitment cap (External Factor: UK Govt’s. Policy) – 2014
(d) Methodology: Panel Data approach based on fixed- and random-effects models.
(e) Empirical Results: by carrying out the Hausman Test it was found that the Random-Effects Model was the most appropriate (see figure below). The findings of the model showed that GDP per capita and government expenditure on education had a positive and statistically significant impact on VA scores. On the other hand, student cap and step marking did not have a statistically significant impact on the dependent variable (i.e., VA score).
(f) Conclusion:
Overall, our results show that an increase in Government expenditure on higher education as well an increase in GDP in per capita can lead to an improvement in VA scores. Therefore, our recommendation inline with our findings is that Government should invest more in HE per capita. For institutions with wide range of students with diverse background (e.g., gender, ethnicity, and disabilities), Government should provide additional support and resources.
Figure 7: Panel Data: Random-Effect Model
Conclusion
The UK Government’s data shows that attainment gaps for undergraduate degree classification in the UK by ethnicity & gender still shows biased towards black and ethnic minority groups. These gaps can be better understood by using the Value-Added Score Metrics at university, faculty, departmental, programme, and module levels. Our panel data analysis shows that higher levels of income per capita and Government expenditure in higher education have statistically significant and positive impact on VA scores. These preliminary results would suggest that more focused policies are required to close this attainment gap.
References
Advance HE (2023). Available at Challenging the BAME attainment gap using the value-added score metric | Advance HE (advance-he.ac.uk)
Arday, J. & H.S. Mirza (2018) Dismantling Race in Higher Education: Racism, Whiteness and Decolonising the Academy, London: Springer.
Gabriella, G. & Ghanei, M. (2021) Team-based learning in economics: Promoting group collaboration, diversity and inclusion, The Journal of Economic Education, DOI: 10.1080/00220485.2021.2004276
Office for Students (2023): BME Attainment GAP. Available at Using the Value Added Score to challenge the BME attainment gap – BME Attainment Gap (closingtheattainmentgap.co.uk)
Richardson, J. T. (2018), “Understanding the under-attainment of ethnic minority students in UK higher education” in Higher Education: Racism, Whiteness and Decolonising the Academy, Springer: PP.87 – 102.
UK Government (2022) Undergraduate degree results. Available at Undergraduate degree results – GOV.UK Ethnicity facts and figures (ethnicity-facts-figures.service.gov.uk)
University of Greenwich (UoG) PAS (Planning and Statistics)
Mahkameh Ghanei is a principal lecturer in the recently formed School of Accounting, Finance and Economics in Greenwich Business School. She is a Senior Fellow of the HE since 2018 and has mentored number of staff for Associate and Senior Fellowship for HE. She has also been a TEF lead for her previous Department (Economics and International Business). She has an extensive experience in teaching Economics at four different Universities in the UK. She is specialised in teaching Microeconomics; Business Economics; Industrial Economics, Organisational Theory, Macroeconomics and Dissertation for under- and post-graduate courses. Her main area of research in Small Medium-Sized Enterprises (SMEs), focusing more specifically on local economy and inner London manufacturing businesses. In the last five years she has also focused her research on teaching pedagogy (Team-Based Learning – TBL); assessment and feedback (feedback loop and feedforward); and student performance using different innovative teaching pedagogy. With the main intention of closing the performance, gender, and ethnicity gaps. She has published the results of her work in the Journal of Economic Education (JEE). Also, presented papers and ran workshop with different colleagues at various conferences.
Francesco Guidi is a Senior Lecturer in Economics at the University of Greenwich Faculty of Business. He graduated from the University of Manchester (UK), with a MSc in Economics and Econometrics and completed his MSc and PhD in Economics at the University of Ancona (Italy). Francesco holds a Post-Graduate Certificate in Higher Education (PGCertHE) awarded by the University of Greenwich (UK). Francesco has been teaching economics, financial economics, and quantitative modules within a wide range of undergraduate and postgraduate programmes (BA International Business, BA Business Economics, BSc in Economics, MSc in Business and Financial Economics, MSc in Economics, and MBA International Business). He has been serving as an International Link Tutor for several international partnerships such as ERCI Singapore, HKMA Hong Kong, LSBF Singapore, SEGI Malaysia and ZCAS Zambia. His research, focusing primarily on financial markets, has appeared in a number of academic journals, such as the Journal of Emerging Markets Finance, Applied Financial Economics, International Review of Financial Analysis, Journal of Multinational Financial Management, Journal of International Financial Markets, Institutions, & Money, and International Journal of Economics and Finance.