South Africa’s Engagement in Counter-Piracy as a Foreign Policy Decision

By  Lisa Otto 

lisa picture

South Africa became involved as a counter-piracy actor rather late in the day, after repeated calls for it to make a contribution to the scourge that was then facing the continent – Somali piracy. Despite the rise of the Somali pirate problem coming in 2007, it was not until the outward ‘ballooning’ effect of the pirates’ reach began to extend southwards towards the Mozambican Channel, that South Africa’s interest was suitably piqued.

 In December 2010 Somali pirates struck off Mozambique’s coast, and the South African Department of Defence responded to this attack on its immediate neighbour by deploying warships to Mozambique. This effort was known as Operation Copper and constituted the very beginning of South Africa’s engagement in counter-piracy efforts beyond endeavours of verbal condemnation.

Not acting on its own recognisance, but rather generously acquiescing to Mozambique’s request for assistance, piracy was suddenly thrust from the periphery of South Africa’s international agenda to a more central position than it previously enjoyed. Albeit one that did yet not necessarily beget much strategic priority.

In February 2012, South Africa’s engagement in counter-piracy became formalised through a Memorandum of Understanding signed in partnership with Mozambique and Tanzania, under the auspices of the Southern African Development Community (SADC).  Subsequently the countries have seen some success, notably in April 2012 when the partnership was put to use to fend off a pirate attack in Tanzanian waters, in collaboration with the European Union (EU) deployment.

Beyond this, Operation Copper has also worked at training efforts as a capacity-building mechanism with neighbouring countries. More recently, South Africa has begun to focus its attentions the Gulf of Guinea also, with the navy being active there in the last two years.

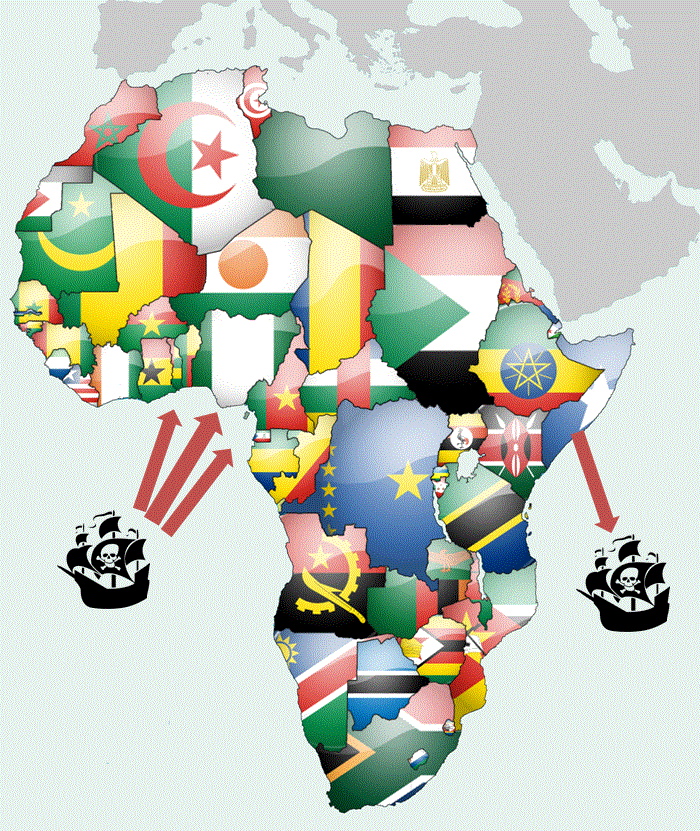
At the time of South Africa’s entrance as an actor in the counter piracy environment, maritime piracy in Somalia had been a problem of global concern for some years. By 2011 this experience had led to a number of experts alluding to the emergence of a new hotspot for Somali pirates in Southern African waters. Given pirates’ dynamic nature and ability to adapt to the challenges they faced, the presence of international forces in the Gulf of Aden would force pirates further south in pursuance of their victims. The trend known as ballooning saw Somali pirates venture far afield.

It was this thinking that underpinned a theory that Southern Africa would soon face dealing with the pirate scourge. This notion, coupled with the need for security in the maritime domain in light of resource discoveries off the coast of Tanzania and Mozambique as well as the active ports at Dar es Salaam, Beira and Maputo seemed to necessitate action. This, along with the successful pirate attacks in Mozambican waters in 2010, the threat must have seemed quite real to South Africa, and potentially also posed a risk to its interests off Southern Africa’s eastern coastline.

Yet, the Somali pirate scourge dwindled significantly in 2012 and 2013 as a number of activities and developments both on land and at sea paid off. Beyond this, Somali pirates have not managed to sustain their campaign further into the Indian Ocean, and ultimately southwards, given logistical challenges. The absence of a safe haven outside Somalia, as well as having to go without the intricate support network in Somalia that provide the very foundations for their activities worsens matters. Establishing new such networks (which would require an environment devoid of effective governance comparable to the erstwhile Somalia) is a task more difficult in the Southern African region given its comparative condition of peace and security. Another option would be the use of a mother ship based in international waters, but this too would require access to a regular supply of food, water, fuel and other items, usually provided by on-shore networks contracted by pirate groups.

Given this and the limited defence budget in South Africa, it may seem curious that the country committed of its limited naval assets to these endeavours. In fact, the allocation to Operation Copper alone in the 2013 budget was R585 million (US$56 million) from a total annual budget of R40 billion (or US$3.9 billion).

Says defence analyst Helmoed Heitman, “either South Africa accepts regional security responsibilities and funds an appropriate defence force, or we wind our neck in, keep quiet and hope nothing goes wrong”. He posits that despite the role of a defence force being to address threats, the budget leaves no room for this, nor for the unexpected. Thus, one might conclude that the expenditure on counter-piracy operations is a frivolous expense, given the state’s primary responsibility of protecting its territory – a place to which pirates have yet to venture. Others may argue that the fact that pirates have not entered South African waters is credit to the capabilities of the navy.

On the balance of this information, how pragmatic is South Africa’s engagement in counter-piracy? Is it a worthy exercise in foreign policy, employing foresight, or does it constitute funds misspent on threat not immediately real to South Africa?

While Heitman makes apt observations with respect to the military budget, it is worth noting that South Africa’s security apparatus are most often deployed in assistance of other nations, often in Africa. South Africa does not fear any immediate threat to its territory, and is therefore able to make use of its defence forces as a tool in the furtherance of its foreign policy objectives, key amongst which is the precedence of Africa.

The fear of pirates’ southward migration offered Pretoria the opportunity to participate through its region in keeping with the country’s foreign policy and the practice of engaging the region as a first port of call. A SADC-based initiative would also be consistent with the African Agenda and the ideal of ensuring that the collective security of the Southern African neighbourhood is safeguarded. These considerations serve to motivate the pursuance of the issue in a way that befits South Africa’s model of foreign policy quite perfectly.

Counter-piracy activities have also allowed South Africa to push back at pirate frontiers farther away from home, effectively assisting neighbours through collaborative efforts, all the while, keeping the trouble at a safe distance from South Africa’s doorstep. This may be considered a pragmatic policy decision – indeed, South Africa is a littoral state with 3,751km of coast line, dotted along which sit a number of crucially important ports with significance not just for South African but for the region as a whole.

Given South Africa’s status as an emerging nation, it also has globalised interests, being impacted by costs brought on by piracy on the global economy, as well as the domestic concerns felt by neighbours. Furthermore, it acts to bolster South Africa’s perceived involvement in a fashionable issue of international proportions, without requiring all too much effort on the part of Pretoria. This too falls squarely in line with South Africa’s implied foreign policy objective of being the foremost African actor participating in the international space – the go-to partner on the continent who leads by example where issues of African security are concerned.

In conclusion, while the cost of South Africa’s counter-piracy engagement may, on the face of it, not appear to equal its benefit, South Africa has managed to structure this engagement in a way that plays to the global image that it works to portray, while expending relatively little resources. From a practical point of view the cost does not seem to meet the minimal realities of its risk, but perhaps in this instance South Africa has made its play on the basis of strategy rather than economics.

Is it necessary for its own security to be actively fighting the pirate threat? No, it is not. But, given the transnational nature of the crime, and nondiscriminatory nature of its effects, it is of crucial importance that states, littoral and landlocked become involved, acknowledge a shared responsibility and tackle the crime as a collective. Experts have long held that a coordinated effort by the international community is needed to turn the tide in the fight against piracy. This is South Africa’s effort to do just that – in this case a responsible global actor, but primarily one taking a path of pragmatic foreign policy.

 A version of this article was first published in the African Armed Forces Journal in November 2014 as a winning entry of the AAFJ Denel writing competition, and the full version may be accessed there.

 

 sa pirates


Role of robots in maritime search and rescue explored

robots

Robots and autonomous underwater vehicles are playing an increasing role in commercial maritime and offshore oil and gas operations for such things as oil and gas exploration, subsea work, repairs and maintenance, and hull inspections. The future will usher in an expanded role for robots and unmanned vehicles. DNV GL, for example, recently unveiled a concept vessel for short sea shipping called the ReVolt that is fully battery powered and unmanned.

The NATO Centre for Maritime Research and Experimentation (CMRE), part of the NATO Science and Technology Organization, recently held sea trials that successfully tested and demonstrated the integration of robotic platforms, including Unmanned Surface Vehicles and Unmanned Aerial Systems for Search and Rescue (SAR) operations. The sea trials, from October 13 to 24, were held as part of ICARUS (Integrated Components for Assisted Rescue and Unmanned Search operations) project, which is funded by the European Commission under the Seventh Framework Programme for Research and Innovation (FP7).

Since 2012, ICARUS has been developing advanced robotic platforms that can support crisis intervention teams in detecting, locating and rescuing humans in danger, in maritime and land disaster scenarios.

Unmanned Search and Rescue (SAR) devices offer a valuable tool for saving lives and for speeding SAR operations.

This is crucial for maritime incidents where survival times are short and SAR teams can be exposed to considerable risks.

For such events, Unmanned Surface Vehicles (USVs), capable of transporting SAR equipment and deploying first aid devices, can greatly improve the efficiency of operations.

Existing technologies have been improved to strengthen resilience, and new developments include robotic vehicles that can deploy autonomous life saving capsules, using mission planning software, new sensors and new data acquisition capabilities to detect and track survivors.

Experts in maritime robotics and target recognition, CMRE is collaborating with the Laboratory of Microgrids and Electric Vehicles, Portugal, in the framework of ICARUS to enhance the autonomy of robotic surface vehicles and is also involved in the integration of the main USV into the ICARUS Command, Control and Interface (C2I) station collaborative operations with aerial robots.

The ICARUS project is managed by a consortium of 24 public and private partners from 10 countries.

One of the central objectives of the project is to bridge the gap between robotic laboratories and the application of novel robotic devices to real-life situations in the field, paving the way for cutting-edge technologies to be used in Search and Rescue operations.

In 2015, the technologies developed during the ICARUS project will be tested in two scenarios, one a simulated earthquake exercise in Belgium and the other a maritime accident in Portugal.


Source – www.marinelog.com

british commission logo

new researchers

The twenty-second New Researchers in Maritime History Conference will be hosted by the University
of Greenwich in the historic Old Royal Naval College. The conference provides a unique opportunity
for emerging scholars to present their work to a supportive audience in one of the world’s most
iconic maritime settings.

Applications to present will be accepted from both research degree students and by independent
scholars. The organisers welcome contributions that address all aspects of maritime history.

Paper Proposals

Those wishing to offer a paper should please complete the from http://tinyurl.com/qglnfg5.  The deadline is 12th January 2015.

Delegate Registration

Anyone interested in attending the conference without presenting a paper is warmly invited to register via our booking site . http://newresearchersmaritimehistory2015.eventbrite.co.uk

Registration Information

The registration fee includes a welcome reception including keynote address on the Friday evening;
lunch and refreshments throughout the day on the Saturday plus conference materials.

£35 standard fee; £30 student fee; presenters attend for free.

Contact the conference secretariat at: +44 (0)20 8331 7612 or maritimehistory@gre.ac.uk

image of uni

How much bigger can container ships get?

container ship bbc

The world’s cargo ships are getting big, really big. No surprise, perhaps, given the volume of goods produced in Asia and consumed in Europe and the US. But are these giant symbols of the world’s trade imbalance growing beyond all reason?

What is blue, a quarter of a mile long, and taller than London’s Olympic stadium?

The answer – this year’s new class of container ship, the Triple E. When it goes into service this June, it will be the largest vessel ploughing the sea.Each will contain as much steel as eight Eiffel Towers and have a capacity equivalent to 18,000 20-foot containers (TEU).If those containers were placed in Times Square in New York, they would rise above billboards, streetlights and some buildings.Or, to put it another way, they would fill more than 30 trains, each a mile long and stacked two containers high. Inside those containers, you could fit 36,000 cars or 863 million tins of baked beans.

he Triple E will not be the largest ship ever built. That accolade goes to an “ultra-large crude carrier” (ULCC) built in the 1970s, but all supertankers more than 400m (440 yards) long were scrapped years ago, some after less than a decade of service. Only a couple of shorter ULCCs are still in use. But giant container ships are still being built in large numbers – and they are still growing.

It’s 25 years since the biggest became too wide for the Panama Canal. These first “post-Panamax” ships, carrying 4,300 TEU, had roughly quarter of the capacity of the current record holder – the 16,020 TEU Marco Polo, launched in November by CMA CGM.

In the shipping industry there is already talk of a class of ship that would run aground in the Suez canal, but would just pass through another bottleneck of international trade – the Strait of Malacca, between Malaysia and Indonesia. The “Malaccamax” would carry 30,000 containers.

The current crop of ultra-large container vessels can navigate the Suez – just – but they are only able to dock at a handful of the world’s ports. No American harbour is equipped to handle them.

The sole purpose of the soon-to-be-launched Triple E ships will be to run what’s called a pendulum service for Maersk – the largest shipping company in the world – between Asia and Europe.

evoluation of container

They arrive in Europe full, and when they leave a significant proportion of containers carry nothing but air. (At any given moment about 20% of all containers on the world’s seas are empty.)

“Ships have been getting bigger for many years,” says Paul Davey from Hutchison Ports, which operates Felixstowe in the UK, one of the likely ports of call of the Triple E.

“The challenge for ports is to invest ahead of the shipping capacity coming on-stream, and to try and be one step ahead of the game.”

Overcapacity in the world’s ports means there is huge competition for business. Operators cannot afford to get left behind, says Marc Levinson, author of The Box – How the Shipping Container Made the World Smaller and the World Economy Bigger.

“The ports are placed in a difficult competitive position here because the carriers are basically saying to them, ‘If you don’t expand – if you don’t build new wharves and deepen the harbours and get high speed cranes, we’ll take our business someplace else.'”

These big beasts of the sea present ports with other challenges too.

Ship owners also want vessels to be unloaded and loaded within 24 hours, which has various knock-on effects. More space is needed to store the containers in the harbour, and onward connections by road, rail and ship need to be strengthened to cope with the huge surge in traffic.

Felixstowe, which handles 42% of the UK’s container trade, has 58 train movements a day, but plans to double that after it opens a third rail terminal later this year.

Bigger vessels also behave differently in the water. The wash created by a large ship can be enough to cause other ships moored in a harbour to break free – just as the passenger liner SS City of New York did in 1912 when the Titanic set out on her maiden voyage.

“These days with the increase in traffic, we experience this more and more often,” says Marco Pluijm, a port engineer working for Bechtel. “A simple thing you can do is just slow ships down and add some tug boats for better manoeuvring – but that all has cost implications.”

There are currently 163 ships on the world’s seas with a capacity over 10,000 TEU – but 120 more are on order, including Maersk’s fleet of 20 Triple Es.

Bearing in mind that the carbon footprint of international shipping is roughly equivalent to that of aviation – some 2.7% of the world’s man-made CO2 emissions in the year 2000, according to the International Maritime Organization – the prospect of these leviathans carving up the oceans in ever greater numbers is likely to be a source of concern for green consumers.

Maersk, however, argues that the Triple E is the most environmentally friendly container ship yet. (The three Es in the name stand for economy of scale, energy efficiency and environmentally improved.)

Although it will only be three metres longer and three metres wider than the 15,500-TEU Emma Maersk, its squarer profile allows it to carry 16% more cargo.

Re-designed engines, an improved waste-heat recovery system, and a speed cap at 23 knots – down from 25 – will produce 50% less carbon dioxide per container shipped than average on the Asia-Europe route, Maersk calculates.

triple e

“When you get bigger ships, you can more efficiently carry more cargo, so the carbon footprint you get per tonne of cargo is smaller,” says Unni Einemo from the online trade publication Sustainable Shipping. “So on that basis, big is beautiful.”

To achieve maximum fuel efficiency, however, a ship has to be fully loaded.

“They are massive ships, and a really big ship running half-full is probably less energy-efficient overall than a smaller ship running with a full set of containers,” says Einemo.

Maersk’s Triple Es will be going into service at a time when growth in the volume of goods to be shipped is comparatively low – some experts don’t expect it to pick up until 2015. But the world’s container fleet capacity is expected to grow by 9.5% this year alone, as Maersk and others receive the ships they ordered years ago.

Some of the extra capacity will be absorbed in the new practice of slow steaming – industry-speak for sailing more slowly. Sailing at 12-15 knots instead of 20-24 knots brings enormous savings on fuel – but it does mean that extra ships are required to transport the same volume of goods in the same timescale.

Maersk are counting on container trade continuing to grow at 5-6% – less than half the growth rate of seven years ago, but enough to recoup the company’s investment in the Triple Es, which cost $190m (£123m) each.

“The history of container shipping involves ship lines taking huge gambles,” says Marc Levinson, who points to a trend for some American and European companies to move manufacturing back from Asia.

“There are a lot of people in the shipping industry who aren’t sure that Maersk is on the right track,” he says.

Jean-Paul Rodrigue at Hofstra University believes that big container ships like the Triple E will prove their value on specific trade routes, nonetheless.

“Each time a new generation comes along, there’s the argument ‘Oh is this going a little too far this time – is there enough port trade to justify this?'” he says.

“But each time the ship class was able to put itself in the system and provide a pretty good service.”

Marco Pluijm was interviewed on the BBC World Service programme The Forum.

You can follow the Magazine on Twitter and on Facebook

For more information click here 

World maritime trade’s powerful upswing in the new millennium (mainly thanks to China)

 by Richard Scott,

 Visiting Lecturer, Greenwich Maritime Institute and MD, Bulk Shipping Analysis

It could be called ‘the China decade’. World seaborne trade maintained a four percent average annual rate of growth during the past ten years, slightly better than the previous ten-year average. This achievement was especially notable in the light of the global economy’s evolution, featuring a wrenching severe recession. But trade growth at that rate would have been impossible without China’s super-size contribution.

During the past decade, from 2003 to 2013, in numerous highly visible ways, global maritime activities which already had been penetrated were then dominated by China’s presence. This pattern is still ongoing, and signs suggest that it will continue for many years ahead. One of the most important aspects of the trend is the phenomenal expansion of China’s seaborne trade, especially imports.

Other countries contributed rising import demand to world trade as well, but none as spectacularly as China. Until 2008, the global economy as a whole was advancing at a robust pace, providing a broadly favourable backdrop for seaborne imports into most areas. After the 2009 recession, economic activity picked up again, although beyond the initial rebound many countries struggled to make further progress against prevailing headwinds. These were difficult circumstances for trade to resume brisk and sustained expansion, yet that is what happened: world seaborne trade as a whole averaged over four percent growth in 2011 to 2013, returning to its ‘normal’ trajectory.

Goliath task for the shipping industry

Commercial shipping’s existence is mainly related to transporting cargoes. Rapid expansion of trade in goods explains why the world fleet of ships saw such strong growth over the past ten years. The huge trade enlargement recorded was remarkable, since this period included the global ‘Great Recession’ in late 2008, continuing through 2009, following the world financial crisis. That slump was widely seen as the most damaging setback for the world economy since the Great Depression in the 1930s. Global economic activity contracted, world seaborne trade was badly weakened and, unusually for an individual year, 2009 saw an actual decline in annual trade volume.

A few statistics emphasise how the pattern of trade evolved in the past decade. In 2003, world seaborne trade – including dry bulk commodities, oil, liquefied gas, manufactured goods (mainly container shipments) and all other cargoes – totalled 6,676 million tonnes. Ten years later, in 2013, the overall total reached an estimated 9,914mt, based on Clarksons Research calculations, cumulatively a 48.5 percent rise. Looking at individual years, a break in the trend is immediately evident. In 2009 there was a four percent reduction from the previous twelve months, followed by a swift ten percent bounceback in 2010. The general pattern was very positive including, significantly, the latest few years of the period up to 2013.

That is the broad picture, but the development pattern among the individual cargo sectors differed markedly. What is abundantly clear is that dry bulk trade made the biggest contribution to the overall advance. Global dry bulk commodity movements, which comprised 2,453mt (37 percent of the total) in 2003, expanded by seventy-six percent to an estimated 4,309mt in 2013, raising their share of the total to 43 percent. Container shipments also grew rapidly, rising by ninety percent, reaching 1,524mt. The second largest sector, oil (crude oil plus processed oil products) was a laggard, growing by a relatively modest twenty-one percent to 2,834mt over the ten years’ period.

A large part of this expansion, particularly in the dry bulk sector, was attributable to China’s multiplying appetite for imports. An especially valuable contribution to the global seaborne trade trend was seen in 2009. As already mentioned, trade declined in that year, but the downturn might have been much worse than actually occurred. A huge jump in China’s dry bulk commodity purchases, completely opposite to the pattern elsewhere, prevented a much greater overall decline.

Bulk-cargo-shipping-m3


Sea trade in the ten years ending 2013 as a whole was strengthened by many other countries needing increasing imports. A particularly substantial volume of imported cargo movements was added in Asia, alongside China’s additional volumes. Numerous countries in this region, including India, South Korea, Taiwan and smaller buyers, greatly raised purchases of dry bulks, oil, gas and manufactures. Further cargo import quantities were contributed by countries elsewhere around the world.


Figures for seaborne trade compiled by UNCTAD (United Nations Conference on Trade and Development) emphasise how the Asian region led global cargo movements growth. Roughly four-fifths of the entire growth in trade recorded during the period from 2003 to 2012 (currently the latest year for which these statistics are available) was attributable to extra imports into Asia. Another feature, related to the remaining approximately one-fifth of trade growth, is evidence of a reduction in Europe’s imports, a decreasing tendency in North America and a flattish trend in Japan. By contrast both the Middle East area, and a group of all other countries together, showed considerable imports increases.


The real giant awakes

China’s share of global seaborne trade has risen enormously, resulting from its imports growth comprising a very large proportion of world imports growth. As well as providing more cargoes for a greatly increasing China-owned fleet of ships, this upsurge benefited many independent shipowners in numerous countries and, through part of the period, proved highly profitable. Since 2008, however, variable overcapacity in world shipping markets has suppressed earnings for shipping investors.


In the early 2000s, China’s imports of all cargoes – dry bulks, oil, gas and manufactured goods (mostly container shipments) – comprised 5-6 percent of the world seaborne trade total. Global import demand then was still dominated by European countries, Japan and other Asian countries. Starting in 2003, rapid and sustained expansion in China began. Within ten years, a relatively short historical period, a dramatic transformation had occurred. This resulted in China’s share of world seaborne trade expanding almost fourfold from the early millennium, reaching an estimated 20.4 percent in 2013.


The giant’s emergence as an economic powerhouse affecting the world had occurred earlier. In a memorable comment attributed to him, the famous nineteenth century French Emperor Napoleon Bonaparte foreshadowed the eventual impact when he suggested that China’s awakening would shake the world. But such a cataclysmic event was a long time coming. It started happening in 1979 when China’s paramount leader, Deng Xiaoping, began opening up the economy to world trade, bringing the country’s extended ‘slumber’ to a close.


By the 1990s successive reforms had enabled the Chinese economy to achieve many years of very rapid expansion. Because this development was partly based on export sales, particularly manufactured goods, China became a major and then dominant supplier of these products to the world market. There were huge consequences for the maritime scene: seaborne trade patterns in the container shipping sector changed greatly. The world’s new ‘workshop’ became solidly established. But an even larger impact on global maritime trade was still some way ahead, in the new millennium.


During the early 2000s China began focusing on additional external raw materials and fuels supplies amid rapidly expanding industrial output. More agricultural products were also needed. Although domestic resources of many commodities were widely available, these were insufficient in volume and sometimes in quality as well. Industries including steelmaking, power generation, aluminium smelting, and animal feed manufacturing started placing much heavier emphasis on seeking supplies from foreign sources. The strong advance in quantities imported was the result.


Growing annual seaborne imports into China also formed rising percentages of the upwards overall global trade volumes trend. Statistics illustrate how significant this pattern has been for the global shipping industry, which now depends upon China for a substantial proportion of its bulk carrier, tanker and other ship employment. In 2003 China’s seaborne imports totalled just under 500 million tonnes, within a global total of 6,680mt. By 2013 the China volume had risen to 2,026mt within a global 9,914mt total. These Clarksons Research figures emphasise China’s significance for shipping companies, indicating that, during the 2003-2013 period, annual world seaborne trade rose by 49 percent, while within this volume China’s element increased by 305 percent.


The figures quoted here underline how world seaborne trade has risen greatly, and how a large part of that expansion reflected China’s much more rapidly growing imports. From the angle of additional ship employment created, this point is reinforced by looking at the percentages showing what proportion of growth in world seaborne trade volume during the ten years’ period was comprised of China’s expanding imports. It then becomes even more abundantly clear why global shipping industry players are so intently focused on how Chinese industry and agriculture is progressing, the implications for imports, and the evolving relationship between ‘home’ domestic commodity output and import demand.


As already outlined, global seaborne trade grew substantially from 2003 to 2013. Arguably the most spectacular positive feature during the period was that almost one half (47 percent) of the expansion was contributed by additional imports into China. For dry bulk commodities, the contribution was even larger, and therefore even more striking. China’s extra imports of these commodities (raw materials, fuels, other bulk industrial products, soyabeans and other bulk agricultural products), formed fully two-thirds or 66 percent of overall world seaborne trade growth within the sector. Consequently, shipping industry participants are still transfixed by the China theme.


In a range of key individual trades – iron ore, steam coal (used mainly in power stations), soyabeans, bauxite/alumina, nickel ore, crude oil – China has become either by far the biggest importer or one of the biggest. Expanding Chinese import volumes have been, or in some cases continue to be, the main component of global growth in large-scale trades. Shipowners, charterers, brokers and analysts as well as many others are therefore always looking for any clues about key influences: how demand for the products made by relevant industries are developing, what impact there will be on output levels, and what other factors will determine how much raw materials and other inputs will change as a result.


Among individual commodities, iron ore imports into China experienced, over the past ten years, one of the most dazzling performances ever seen in the long history of global maritime trade. China’s iron ore imports have become gigantic, employing a vast armada of bulk carriers, after rising well over five-fold, from 148mt in 2003 to 820mt in 2013. As a result, these now have a dominant role in world seaborne iron ore movements (one of the largest commodity trades), comprising about two-thirds of the total. Moreover, the 2014 China volume could exceed 900mt. Another example of a large volume trade is coal imports, which rose steeply by over seven-fold in the past five years, from 44mt in 2008 to 327mt in 2013. Crude oil and products imports into China by sea in the past ten years also increased robustly, more than doubling from 114mt, to 293mt last year.


A galloping horse

What seems clear is that China will remain a prominent part of global seaborne trade, and probably a key contributor to its growth, over many years into the future. That is not just a wildly optimistic appraisal. Certainly the country’s economic activity is slowing, and the trend may persist, consistent with a maturing economy. This feature reflects the switch of emphasis, from a demand viewpoint, towards consumer spending and away from capital investment (especially infrastructure projects) and exports. Looking at the economy’s supply side, a switch from manufacturing towards services is foreseen. But, while these forces will restrain production of goods with high raw materials content, further growth in imported natural resources and energy is likely.


The Year of the Horse, 2014, in China seems set to prove another period of increases in many commodity imports, and that trend may continue in the medium term at least. There are positive indicators, although the earlier gallop may be moderating towards a fast trot. Nevertheless, there are also reasons for caution or uncertainty about the outlook. Several questions arise. How rapidly will the economy grow in the years ahead? What, precisely, will be the relationship between economic activity and seaborne trade? Is growth in import demand for commodities likely to continue outpacing production increases in dependent industries? How will foreign purchases of agricultural commodities evolve? Answers involve a complex range of factors which are far from easy to assess reliably.


Also relevant to the general picture of world maritime trade’s progress is the contribution of other prominent players around the globe. A detailed examination of export suppliers is beyond the scope of this article. As import generating areas, other Asian countries, and Japan and Europe as well as the USA are particularly significant. Also, some emerging economies in the Middle East, South America and Africa are becoming more prominent influences. Currently the advanced economies group (mainly Europe, USA and Japan) is still having difficulty shaking off the long term debilitating effects of the 2009 recession and its problematical aftermath, with adverse implications for seaborne trade. Until there is a stronger import purchases trend in these countries, world seaborne trade’s great reliance and concentrated focus on China will persist.


One of the Seven Engineering Wonders of the World: The Panama Canal

By 

Dr Chris Ware 

con pana  current pana

One hundred years ago today ( 15 August) the Panama Canal was opened to traffic, no longer would vessel have to round Cape Horn against prevailing Westerly wind instead they would transit the 49 miles from Atlantic( Caribbean) to Pacific. The idea not new would only be realised at the end of the 19th Century when first the French sort drive a series of cuts and locks across the Isthmus, this first effort would end in Bankruptcy and a large death total, upward of 22,000 died from fever.

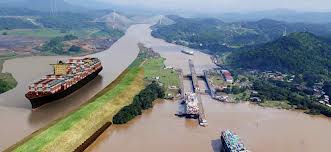
It would be the United States which would, in 1904, take over the project and take a lease on a strip land across Panama, and complete the work by 1914.This allowed the American’s to move the Warships from the Atlantic to the Pacific and allowed the increasing trade of the West Coast of the US to follow East and vice versa.  Now the Canal is being widened and there is talk that Nicaragua is looking to build a canal. % 25 percent of the world tonnage is built to Panamax standard, ships which can transit the Canal, however less than 2% per year actually do so, the remodel Canal will allow large ships with better hull forms to be built and run. If the Pharos of Alexandria and the Colossus of Rhodes were wonders of the ancient world, the Panama Canal stand as one of the engineering wonders of the 20th century and beyond.

contruction pana


Bulking up in Africa: China inflates seaborne minerals export trade

by Richard Scott

Visiting Lecturer, Greenwich Maritime Institute and MD, Bulk Shipping Analysis

cargo robert 1

Africa’s profile as an exporter of dry bulk commodities is rising. Responding to growing import demand from China, India and other buyers in the past decade, many new African suppliers have entered the market. Seaborne dry bulk exports by countries in Africa now exceed 200 million tonnes annually, about 5% of the global total, and further growth is predicted over the years ahead. Expansion has been especially notable in the iron ore and coal trades, the focus of this article.

Seaborne exports growth from Africa benefits the global shipping industry in two ways. Larger volumes moving create additional employment for bulk carriers, many of which are operated by independent shipowners. Also, because a large element of new commodity supply is coming out of West Africa, destined for Asian receivers, long-haul voyages amplify the extra cargo-carrying (deadweight) capacity needed.

There is a remarkable historical precedent. Around fifty years ago, back in the 1960s, Africa rapidly became much more significant as an exporter when iron ore deposits were opened up in several West African countries, mainly to supply the European market. This trade subsequently diminished and was overtaken by the emergence and eventual dominance of South Africa as the continent’s chief iron ore and coal exporter. The current phase starting in the past few years represents, partly, a reprise of earlier events in West Africa, accompanied by some new developments elsewhere.


A steely embrace

For most of the past ten years coal, from South Africa, was the largest dry bulk cargo export movement originating in the African continent. But in 2013 Africa’s iron ore exports, which had been rising, especially in the five years since 2008, became the largest element. Estimates point to last year’s iron ore total reaching about 91mt. South Africa’s contribution comprised more than three-fifths. The remainder consisted mainly of shipments from Mauritania plus the rapidly expanding resumed exports from Sierra Leone and Liberia.

A large proportion of iron ore exports growth reflected China’s expanding requirements amid rapid steel production increases. During the five years period from 2009 to 2013, Africa’s annual ore exports total increased by 49mt. In the same period African cargoes transported annually to China rose by over 48mt, based on official Chinese import figures. This relationship clearly demonstrates the significance of China for the development of African trade. Although South Africa was the main origin of iron ore purchases by Chinese buyers, supplying 43mt last year, increasing volumes were bought from Mauritania, reaching 9mt in 2013. During last year and the preceding year, Sierra Leone became a much more important supplier to China, with the annual quantity surging to 12mt in 2013. Smaller volumes in the past twelve months were derived from Liberia (just over 1mt) plus a minor 0.2mt from Guinea.

Iron ore exports from South Africa more than doubled in the past ten years. From 23mt in 2003, the total rose to 58mt in 2013. The largest part of this growth occurred within the past five years, reflecting greatly increased volumes purchased by Chinese buyers. Ore deposits are mainly located in the Northern Cape Province, where Kumba Resources’ Sishen mine is by far the biggest. This mining area is linked by a railway, 860 kilometres in length, to Saldanha Bay port north-west of Cape Town, which has a terminal (operating since the mid-1970s), designed for capesize bulk carriers.

The ramping up of iron ore exports from West Africa within the past few years is particularly noteworthy. Mauritania’s shipments showed gradual growth over the past decade. Liberia and Sierra Leone, by contrast, remained absent from the international market until 2011 when they both resumed participation on a minimal scale; then there was a rapid building up of sales over the next two years.

In Mauritania, sales historically were focused on Europe’s steel industry, involving a relatively short-haul sea voyage implying lower transport costs compared with more distant sources. Since the mid-2000s a changing emphasis towards Asian markets resulted in the share of long-haul shipments from Mauritania growing. Although the total exported by state-owned iron ore miner SNIM increased only slowly to 13mt in 2013, volumes shipped to China rose very strongly, resulting in China becoming by far the largest customer. This growth was assisted by Nouadhibou port’s recently enlarged ability to load capesize bulk carriers (typically 180,000 deadweight tonnes capacity), often the most economical vessel size for ore trades.

Liberia’s iron ore production ceased during the civil conflict, which persisted from 1989 for fourteen years. In September 2011 global steel producer ArcelorMittal restarted ore exports, when a 63,000 tons panamax size shipment was loaded at Buchanan port. As volumes from the Yekepa, Nimba mine rose, an offshore loading facility for capesize bulk carriers was subsequently introduced. Then, at the beginning of this year, shipments resumed from the long-closed Bong mine. New operators China Union (part of Wuhan Iron & Steel), a majority shareholder in Bong, plan to move 50,000 tonnes monthly through 2014 to China from a new pier at the port of Monrovia.

Also in this mineral-rich corner of West Africa, Sierra Leone’s iron ore mining has come back to life vigorously. A 50,900 deadweight bulk carrier departed from the port of Pepel in November 2011 carrying an ore cargo, reinstating another long-defunct operation. Mining company African Minerals has installed a capesize transshipment facility at Pepel to serve its Tonkolili mine. Another mining company, London Mining, began exporting from its Marampa mine in 2012, utilising river barge movements and a transshipment operation at the port of Freetown.


A curious venture

All these three West African countries – Mauritania, Liberia and Sierra Leone – have plans to greatly expand iron ore production and exports over the next few years at least. Another project, regularly making newspaper headlines, is the plans to develop a vast iron ore deposit contained within the Simandou mountain range of Guinea. This project, which could eventually yield up to 100mt of high-quality ore annually for foreign markets, has seen controversial ownership changes. One prominent problem for the developers is the proposed mine’s remote location, requiring construction of a 650 kilometer railroad through difficult terrain to the port of Conakry. The total cost has been variously estimated at $18-20 billion, including mine infrastructure, building a new railway, plus developing the port to handle large ships.

The renewed prominence of the name Simandou resonates with events about fifty years ago. During the early 1960s, iron ore was being produced in Guinea at a deposit about five miles from Conakry and exported to Europe, mainly to the United Kingdom. The Guinean government decided to purchase a new bulk carrier, intending to employ it in the ore trade from Guinea to the UK. This story is told by Iain Harrison, founder and chairman of shipowners and managers Harrisons (Clyde) Ltd, in his fascinating history of the family company, entitled ‘A Curious Venture’. A bulk carrier of 15,000 deadweight tons named ‘Simandou’ was ordered from shipbuilders Scotts of Greenock and delivered in 1963. Harrisons arranged the deal and were appointed managers. But a long term contract for employment in the intended iron ore trade proved unobtainable, and so the ship was used in open market dry cargo trades around the world.

cargo robert


A generation game

Africa’s coal exports scene has been dominated by South Africa. But the South African trend over the past ten years was fairly flat, as various influences restrained sales despite robustly growing global import demand. Supplies from South Africa mainly comprise steam coal, chiefly used in electricity generation. A small proportion, less than 2 percent, of exports is coking coal used by the steel industry. After totalling 71mt in 2003, there was a dip in the 2008 and 2009 period down to 63mt annually, before a recovery to 74mt in 2013. During this period, emphasis switched away from European destinations towards faster growing Asian markets, especially India, and also China.

Although South Africa is ideally situated to supply both Atlantic and Pacific markets, this advantage was not exploited to maximum benefit in recent years. Most coalfields are located in the country’s north east, and are linked by rail to the principal coal loading port of Richards Bay, on the east coast north of Durban. This port has been expanded greatly to enable huge volumes to be handled, theoretically now 91mt annually, but the higher capacity remains under-utilised. Lack of strong growth has been attributed to inadequate rail transport connections with the coalfields, and also to insufficient mining capacity, together restricting sales.

While South Africa’s coal exports are much larger in volume than exports from other African countries, developments elsewhere in the past few years have often attracted a far greater degree of interest. This characteristic particularly applies to Mozambique, where the challenges for producer exporters could be described as tough, similar to those faced by some new iron ore shippers in West Africa. Mozambique, and also Botswana, possess huge deposits of good quality coal, but developing the infrastructure (railroads and ports) required to enable access to international markets is a hugely expensive and lengthy process.

Coal mines in the Tete province of Mozambique, where coking as well as steam coal grades are available, started exporting small quantities in 2011, leading to more substantial exports of about 3mt in 2012. Brazilian mining company Vale started producing at the Moatize mine in 2011, transporting coal along the 575 kilometre Sena railway to Beira port. Anglo-Australian mining company Rio Tinto began producing at the Benga mine in 2012. Last year, a further increase in the country’s exports, reportedly to about 5mt, was seen.

Expanding the capacity of the existing rail route, and building a new route, will enable more coal to be exported from Mozambique. The Sena railway is being upgraded from a maximum 6.5mt annually to 20mt, and the handling capacity at Beira is being raised. A new 912 kilometre line carrying coal through Malawi to a new deepwater loading port at Nacala in northern Mozambique is due for completion at the end of 2014, with potential for carrying up to 18mt exports.

Problems associated with developing mineral resources for export were highlighted by a news item at the end of July this year. The Financial Times reported that Rio Tinto had finalised the sale of its Benga coal mine and other Mozambique coal assets, to an Indian state-owned company, for $50 million. This price tag is only a small fraction of the $3.7 billion originally paid by Rio Tinto in 2011 for the Riversdale company owning these assets, described by the FT as a “disastrous acquisition.” The logistical challenges of transporting coal from Tete to the coast, and a reduced estimate of recoverable coking coal volumes had been identified earlier as key problems, amplified later by the adverse impact of sharply lower international prices.


Maritime momentum

Looking at how the sea trade scene as a whole has been evolving, the pull of increasing demand from Asian markets, in particular China and India clearly has been a crucial factor stimulating and underpinning Africa’s dry bulk commodity exports growth. Assuming that this influence remains favourable over the years ahead, further expansion in a number of trades seems predictable although timescales and volumes are harder to estimate precisely. Large-scale iron ore and coal mining projects are under way in several countries already, as we have seen, and more are planned, together with related infrastructure developments, aimed at expanding foreign sales.

The sheer magnitude of the task of organising minerals movements, from inland locations to coastal loading ports, for onwards sea transportation to foreign markets, has sometimes been daunting. For several projects the costs are proving almost prohibitive. This problem is, of course, related to commodity prices obtainable on the world market. If prices are high enough, projects with even excessive costs can prove profitable. But recently iron ore and coal prices have fallen steeply from peak levels as huge additional relatively low-cost supplies become available around the world, resulting in greater challenges for some developing African projects.

International seaborne movements of dry bulk cargoes originating in African countries are not entirely confined to iron ore and coal. These two commodities have seen probably the most impressive developments and export growth in the past decade, but others are significant. Among minerals, bauxite and its processed form alumina, especially from Guinea is a key element, while phosphates from Morocco is another prominent example. Altogether, annual mineral exports by sea from Africa have grown by about 50 percent during the past ten years, to an estimated total now exceeding 200mt, as mentioned earlier. This expansion has raised the continent’s status in the global shipping market. It has been reflected in the much higher deadweight volume of bulk carriers employed in trades, many involving long-haul routes, beginning in ports in West African and southern African countries.

A maritime trade showpiece: starring China this year, old Soviet Union yesteryear

BLOG by Richard Scott, 30 June 2014

grain image grain on a ship grain-ship 2

Seaborne trade in cereals and oilseeds has been centre-stage in the maritime world for a very long time. From early civilisations to the present day, movements of these commodities have been a familiar feature of the international shipping business. In the contemporary era, what is referred to as grain and soya trade is broadly spread geographically, with many importers and many exporters participating. Among individual importing countries, one is now by far the largest and another, now a relatively minor participant, was the largest player three decades earlier.


China has emerged in the twenty-first century as the biggest single importer, mainly of soyabeans although grain (comprising wheat plus corn and other coarse grains such as barley) is becoming more significant. Not so long ago, in the nineteen-eighties, it was the old Soviet Union that was in a similar position of prominence. In those days Soviet grain imports – mainly wheat and corn, accompanied by limited volumes of soyabeans – were an especially difficult-to-predict element of global dry bulk commodity trade, and the sudden emergence of a large Soviet buying programme sometimes had a jolting impact on the panamax bulk carrier market and freight rates.

grain 3


During much of the 1980s, the Soviet Union’s demand for grain from foreign suppliers often mesmerised attention in both commodity and freight markets. At its peak this import demand comprised a maximum 25 percent of total global grain and soya trade, and was typically a lower percentage. So it was not really dominant but nonetheless was huge, very variable from year to year, famously unpredictable, and the abrupt changes in monthly shipment volumes gave the trade a reputation for highly erratic progress. Over the following decade it fell back to relatively small volumes.


By contrast the current number one purchaser China, which in 2013 comprised just under 20 percent of global grain and soya imports, exhibits steadier momentum. The usual pattern of activity does not have such a massive disrupting effect on markets as that of the previous top importer, thirty years earlier. Moreover, the longer-term trend for Chinese imports is, arguably, clear: substantial evidence points to vigorous further expansion through the 2010s and perhaps beyond.


Shipping’s Kremlin-watchers

In the decade or so prior to the break up of the Soviet Union into its constituent republics at the end of 1991, grain purchasing on international markets was tightly controlled by the state through its buying agency Exportkhleb. Consequently, Kremlin-watching in the grain and freight markets became an art form. Traders, shipbrokers and shipowners were looking for any signs indicating how much imported grain would be needed, the countries of origin, and what were the likely shipment periods. All these elements greatly affected bulk carrier demand and freight rates.


Dry cargo shipbrokers often focused intently on grain. Although by 1980 iron ore already had been for some time the biggest seaborne dry commodity trade, and coal trade volumes exceeded grain volumes by the mid-1980s, grain retained a disproportionately great influence on the freight market. A widely held view, much of the time, was that grain moved the freight market up and down (although this was not always meant completely literally: it was a broad generalisation).


Several factors explained grain’s market-moving ability. Substantial trade volumes typically entered the market abruptly and, often, unexpectedly. Demand for shipping capacity was augmented by longer loading and discharging operations (compared with mineral trades, for example) with slow discharge rates especially evident in many ports. Delays due to port congestion could be a feature. Relatively inefficient use of a ship’s deadweight (a measure of carrying capacity based on weight lifted) was observed, because some grains were ‘light’ and would fill a ship’s cubic capacity without making full use of the weight capacity available.


Also, characteristically, much grain cargo transportation was arranged on a ‘spot’ basis. Movements often did not form steady flows but were ‘bunched’ (due to the nature of grain buying activity with its fluctuations both in timing and geographically). The related predominant single-voyage charters, as the main chartering mode, amplified the impact of the other features.


All these ship demand enhancing and market-moving aspects were prominently displayed in the Soviet grain import trades. But it was the sheer magnitude (relative to other dry cargo movements in that era) of the Soviet Union’s requirements, and the variability of volumes coupled with forecasting difficulties, which magnified the freight market impact.


Conversation among shipbrokers meeting on the trading floor of the impressive old Baltic Exchange building in St Mary Axe, London had often turned to grain trade. One familiar refrain was “people need to eat” and, as if to underline the point, this discussion might be soon followed by a visit to the luncheon room downstairs to consume a healthy repast. Although perhaps simplistic, the identification of necessary food intake based on imported grain, as justification for a positive view of grain trade and its requirement for shipping capacity, was essentially correct. In the second half 1970s world seaborne grain trade had increased by an average 7 percent annually, although in the 1980s growth was much slower, averaging under 1 percent annually.


More sophisticated arguments were discussed in the 1980s when analysts visited the US Department of Agriculture’s sprawling complex in downtown Washington DC. Talk immediately turned to the Soviet Union’s grain imports. Questions included how much would they buy, over what period, and from where. USDA economists wanted to know whether there were any indications of unusual large-scale activity in the charter markets which could give advance clues to the Kremlin’s import programme ahead, and what might be the impact on ocean freight rates. Answers, if there were any, were often hazy. Most of the time, nobody really knew until the anticipated activity actually happened.


Potent performer: the old Soviet Union

What was the extent of Soviet grain imports in the 1980s and why were the volumes so changeable? Annual imports, mainly wheat plus corn and other coarse grains, together with relatively small quantities of soyabeans, varied between 29 million tonnes and 56mt. For six individual years within the decade, the range was fairly narrow, at between 29mt and 35mt. Three years saw 40-49mt. Within these totals, soyabeans comprised about one million tonnes annually.


The Soviet grain imports peak occurred in trade year 1984/85 (a twelve months’ period measured from the middle of one calendar year to the next, commonly used in agricultural trade statistics) when 56mt was recorded. It was preceded and followed by volumes at the low end of the range, 34mt in 1983/84, and 32mt in 1985/86. This surge and retreat, and some other sizeable year-to-year changes during the decade, had a great impact on short-term demand for bulk carriers.


Large annual variations in the Soviet Union’s domestic grain production, and associated variations in state procurements, mainly explain the fluctuations in foreign purchases, although numerous other factors were reflected in import changes as well. When a poor harvest (compared with the previous harvest) was experienced, mainly caused by changed weather patterns, higher imports were arranged in the ensuing twelve months to offset the shortfall. Conversely, a good harvest was followed by reduced imports. For example, a 20mt (20 percent) fall in grain output in the 1984 harvest, reducing the total to 173mt, prompted the following 23mt imports increase to 56mt.


Production variations (both volume and quality) and, especially, severe shortfalls in some years were not entirely due to weather changes. Temperature or rainfall extremes were detrimental, as in most other grain producing countries. Varying degrees of ‘winterkill’ were experienced, while an occasional sukhovey (extremely hot, desiccating wind) sweeping across the Steppelands of Kazakhstan and Western Siberia severely cut grain yields. Additionally, Soviet farm operational efficiency was not always adequate, and sometimes noticeably lacking, partly reflecting state organisational deficiencies. The results were seen in avoidable planting delays and insufficient seed supplies; inadequate fertiliser or pesticide supply, or mistimed application, or both; and farm machinery shortages or breakdowns and lack of spare parts (for tractors, combine harvesters and other machines).


Another clearly observable influence affecting Soviet grain import requirements was rising demand. Consumption as human food remained fairly static over most of the 1980s period, at about 47mt per year. By contrast, consumption within the feed sector (livestock feed) rose by over 2mt annually, or about 20 percent cumulatively during the decade, amid intentions to boost meat and dairy products availability.


On the supply side, an endemic problem was the large amount of the domestic grain harvest wasted as a result of system inefficiencies. Losses before and after harvesting, and in transport, storage and processing, were proportionately much higher than seen in other countries. USDA economists made estimates for ‘dockage-waste’ varying between 16mt and 30mt annually during the 1980s (10-15 percent of gross harvest output). These amounts included allowances for above-average moisture content (exaggerating the grain volume), and extraneous matter included such as weeds, soil and pebbles which also inflated the total, as well as transport and handling losses.


Soviet Union imports were also affected by changes in grain stocks, and in availability of other domestic crops contributing to livestock feed, known as forage crops. Finally, the amount of grain bought from foreign suppliers depended upon hard currency availability (earnings acquired from oil exports were influential), payment terms, international grain prices, and foreign exchange rates. Ocean freight costs were significant as well.


Powerful player: China      

Compared with the predecessor prime player the factors explaining China’s emergence, as the top individual importer of grain and soyabeans, have been more transparent. The country has remained largely self-sufficient in wheat, corn and other coarse grains (as well as rice), although there are now signs of greater dependence on foreign supplies. For soyabeans, which comprise the biggest proportion of overall grain and soya imports into China, there has been a strong upwards trend over many years as domestic production remained limited amid vigorously expanding consumption.


In calendar year 2013, China’s imports of grain and soya reached 75mt, comprising approximately one-fifth of global seaborne movements in that category. The annual total had expanded rapidly over the preceding decade, from 23mt in 2003, a cumulative 234 percent rise. Within this total, the dominant soyabeans imports more than tripled, to reach 63mt last year. Moreover, a sustained expansion seems likely to continue in the years ahead, based on evidence of underlying influences.


Consumption growth was an especially notable trend affecting imports. The capacity of Chinese oilseed crushing mills has been greatly enlarged so that imports of soyabeans, the form in which most foreign soya is purchased, can be processed into the required meal and oil output. Soyameal is a key high-protein ingredient of livestock feed, usage of which has expanded amid increasing domestic production of animals providing meat and dairy products to satisfy rising consumer demand and amid large-scale poultry exports. Soyaoil consumption in food manufacturing and home cooking has risen greatly, resulting from growth in these activities.


The strong soyabeans import trend also has reflected lack of growth, and subsequently reduction, of domestic soyabeans production in China. During the period of five years up to and including 2010, soyabeans harvests averaged just over 15mt. The next three years saw a declining trend to about 12mt in 2013. Another factor boosting imports was the government’s policy of building up strategic reserve stocks (responding to growing dependence on foreign suppliers).


China has been successful in raising its wheat, corn and other coarse grains output in recent years, despite limiting factors such as land and water availability. This trend was encouraged by continuing reforms over an extended period, as the agricultural sector experienced a transition from a planned economy to a market based economy. Last year’s harvest, totalling 346mt, was 51 percent higher than average annual output in 2003-2005. But the domestic market for these grains has tightened, amid rising consumption. Consequently imports, while still relatively small, have increased. In 2013 the total reached over 12mt, an almost seven-fold rise compared with a decade earlier.


Beneficiary: the shipping industry

Both these examples – yesterday’s Soviet Union and today’s China – show how, in different periods, a grain and soya importing country became a very prominent maritime trade feature. In each case the impact on the global shipping industry created substantial additional employment for bulk carriers. Much of the trade involved long-distance voyages from loading ports in the USA, Canada and South America (Brazil and Argentina), as well as shorter voyages from elsewhere, further enhancing ship employment. China is expected to remain an expanding user of maritime transport capacity for this purpose, over the decade ahead.


Direct effects on the ocean freight market, especially when sharp changes in chartering activity occurred, were more prominent during the earlier episode. Soviet chartering often had a great impact on market conditions and freight rates for panamax and other size bulk carriers, although not always for extended periods. The intensity of impact varied amid differing tonnage (vessel) supply/demand balances and amounts of tonnage available on the open market for spot employment. In the early- to mid-1980s, a general global tonnage surplus tended to mitigate the positive impact on freight rates of temporary extra trade volumes.


Although the ‘China effect’ from this commodity category in the present era has not been as striking as the earlier ‘Soviet effect’ was at times, it looks set to be longer-lasting. But all predictions should be treated with caution. As the Chinese proverb says: “he who lives by the crystal ball will die of ground glass”. A useful reminder!


Richard Scott

Visiting Lecturer, Greenwich Maritime Institute and MD, Bulk Shipping Analysis

Maritime student Robert Forrester writes A History of the Royal Mail Steam Packet Company and Royal Mail Lines, 1851-1965


ROBERT FORRESTER


Robert’s background

Robert Forrester spent twenty years at sea as a deck officer, the last ten of them with Royal Mail Line making frequent voyages to South America prior to leaving the sea in 1965.

The next twenty-odd years were spent involved with newspaper and magazine publishing, latterly as MD of the company producing magazines for British Airways, and others.

Following his retirement he studied for an MA (2001) in Maritime Studies at the Greenwich Maritime Institute followed by a PhD in 2006 and now he sees his book available to buy a many good book stores.


book


What the book is about

During the nineteenth century Britain’s maritime, commercial and colonial interests all depended upon a regular and reliable flow of information from around the globe. Whilst the telegraph increasingly came to dominate long-distance communication, postal services continued to play a vital role in this network of information exchange, particularly to the more distant locations. Consequently, much importance was placed upon international mail services by the British government and the Admiralty, who provided large subsidies to commercial companies to run these concerns.

Concentrating on the mail service between Britain and South America, this book explores the economic, maritime and political aspects of the Royal Mail Lines company, who held Admiralty and Post Office mail contracts between 1851 and 1965.As well as providing a business history of the Royal Mail Lines, the book reveals the many and varied consequences of maintaining a long-distance mail service.

Improved ship design, the establishment of a network of coaling stations, the availability of inexpensive transatlantic passenger crossings for immigrants, increased cargo capacity allowing increased imports of coffee and frozen beef to Europe, the linking of South America to international markets and commercial opportunities, were just some of the spin-off benefits of Britain’s subsidised mail services.

The book also addresses the international competition faced by Royal Mail Lines, which reflected Britain’s diminishing dominance of global trade and shipping. In all this book has much to say that will interest not only business historians, but all those seeking a better understating of Britain’s maritime and economic history, and changing patterns of global information exchange.


For more information or to purchase a copy click here 

Greenwich named as University of the Year by Marine Stewardship Council


greenwich trophy


The Marine Stewardship Council has named Greenwich as its University of the Year in a new series of awards recognising leadership in supporting certified sustainable seafood.

Top chef Raymond Blanc OBE and the food chains Waitrose and Marks & Spencer are among the other individuals and organisations to be honoured.

Greenwich’s prize has been awarded for its active engagement with the ‘MSC Investigates’ series of animated films which involved internal and social media marketing. It said that over 30 universities got involved with this initiative, but none more so than Greenwich.

“Students at Greenwich can be confident that their university is only serving sustainably sourced fish,” says Emily Mason, Sustainability Project Officer at the university. “This is all part of our Sustainable Food Policy. Along with our catering contractors, Sodexo and BaxterStorey, we are working hard to incorporate environmental, ethical and social considerations into everything that we serve in our cafes and restaurants.”

The university has a strong track record of achievement in environmental issues. It won the Times Higher Education Award for Outstanding Contribution to Sustainable Development in 2013 and is a past winner of the People & Planet Green League Table of universities.