Shocking report into the Asian slave labour producing prawns for supermarkets in US, UK

asian trawler image


A six-month investigation has established that large numbers of men bought and sold like animals and held against their will on fishing boats off Thailand are integral to the production of prawns (commonly called shrimp in the US) sold in leading supermarket  around the world, including the top four global retailers: Walmart, Carrefour, Costco and Tesco.

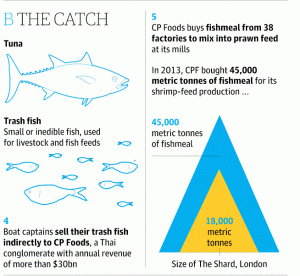
The investigation found that the world’s largest prawn farmer, the Thailand-based  Chareon Pokphand (CP) Foods, buys fishmeal, which it feeds to its farmed prawns, from some suppliers that own, operate or buy from fishing boats manned with slaves.

Men who have managed to escape from boats supplying CP Foods and other companies like it told the Guardian of horrific conditions, including 20-hour shifts, regular beatings, torture and execution-style killings. Some were at sea for years; some were regularly offered methamphetamines to keep them going. Some had seen fellow slaves murdered in front of them.

More details on this shocking report can be found on the Guardian’s website


The facts 

Thailand produces roughly 4.2m tonnes of seafood every year, 90% of which is destined for export, official figures show. The US, UK and EU are prime buyers of this seafood – with Americans buying half of all Thailand’s seafood exports and the UK alone consuming nearly 7% of all Thailand’s prawn exports.

“The use of trafficked labour is systematic in the Thai fishing industry,” says Phil Robertson, deputy director of Human Rights Watch’s  Asia division, who describes a “predatory relationship” between these migrant workers and the captains who buy them.

“The industry would have a hard time operating in its current form without it.”


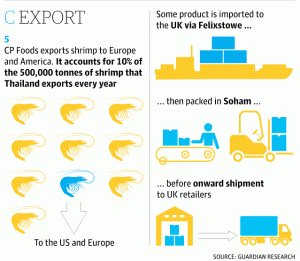
Below is the process which demonstrates how slaves are being used to produce prawns to your plate:


the big catch - part one the big catch - part two the big catch- part three


From this report it is clear to see how, as consumers, we need to be aware when buying prawns from the mentioned retailers, we should be more conscious on how this has arrived at this outlet and if indeed there are alternative outlets we can use to avoid using these poor slaves in the production.


Exclusive one day short course- Britain’s Oldest True Police Force: Policing the River Thames

Saturday 13th September 2014

Led by security expert Professor Chris Bellamy, Director of the Greenwich Maritime Institute, this course tells the tale of protecting life and property and preventing crime from the foundation of the Marine Police in 1798. Now known as the Metropolitan Police Service Marine Policing Unit (MPU), it inspired Robert Peel’s creation of ‘The Met’ in 1829, and was incorporated into it ten years later.

Today, the MPU is still based on the site of its original headquarters at Wapping, and is responsible for 47 miles of the river Thames and 250 miles of canals, lakes and inland waterways within the capital. They are now supported in their rescue duties by RNLI lifeboats, a London Fire Brigade fire boat, and Coastguard services.

This course will look into the history of the MPU, the challenges it faced and its development into the force we see patrolling the River Thames today.

police<

Location and Duration of the Course

This course will take place from 9.30am – 4.30pm on Saturday 13th September 2014 at the University of Greenwich, Queen Anne Court, Old Royal Naval College, Greenwich, London, SE10 9LS.

thames<

How to Apply

The cost of the course is £90 per person and will include course materials, lunch, refreshments and a certificate of attendance.

All places must be booked in advance by Sunday 31st August 2014. Please use our booking website http://tinyurl.com/oevq4ds

Exclusive short course on China’s seaborne trade and maritime defence

Thursday 11th September 2014

This short course is organised with the support of the China Maritime Centre and will be led by the Centre’s Director Dr Minghua Zhao, international shipping analyst Richard Scott and naval defence specialist David Wilkinson.

The course will investigate China’s rapid growth in seaborne trade of all types and the impact upon global maritime business; it will also examine the recent history of the Chinese People’s Liberation Army Navy (the PLAN) in the light of American and Chinese concerns.

ship

What will you study?

The key topics covered will be:•China’s Cargo Trade: attaining global giant status
•China’s Oil and Gas Trade
•The People’s Liberation Army [Navy] (PLAN): The rise of capability and ambition

china - banner

Location and Duration of the Course

This course will take place from 9.30am – 4.30pm on Thursday 11th September 2014 at
University of Greenwich, Queen Anne Court, Old Royal Naval College, Greenwich, London, SE10 9LS.

How to Apply

The cost of the course is £90 per person and will include course materials, lunch, refreshments and a certificate of attendance.
All places must be booked in advance by Sunday 31st August 2014. Please use our booking website http://tinyurl.com/qebczo3

Stepping on the gas: LNG shipping poised to accelerate

It has become a more visible and fascinating part of maritime business. The seaborne liquefied natural gas trade, and the almost 400 highly specialised tankers which serve it, are now a larger part of global shipping activity. The substantial LNG carrier newbuilding order book at shipyards implies rapid fleet growth in the next couple of years, and probably for much longer.

How has this trade evolved, and what are its prospects in the period ahead? Increasing world movements, and expectations of a continued and accelerating upwards trend, have persuaded many shipping investors that there will be good returns. But the participation price is high, with the bigger gas carrier newbuildings costing multiples of VLCC (very large crude carrier) or capesize bulk carrier prices, for instance.

ship

Another aspect, entering the maritime scene, is the associated development of floating liquefied natural gas (FLNG) installations. These are designed to provide an offshore alternative to land-based plants processing gas into liquid form for transportation. Adding to the sometimes confusing abbreviations, at the other end of the voyage a floating storage and regasification unit (FSRU) may be employed. As its name implies this unit, again an alternative to a plant situated on land, reconverts the liquid into the original form of gas for direct consumption. Capital investment involved in such floating appliances is vast.

Happy 50th anniversary, world fleet!
LNG seaborne trade began on a commercial scale exactly fifty years ago. Previously, some experiments had proved the technical feasibility, but not the economic viability. Several years later, in 1964, the first large-scale liquefaction plant was opened in Arzew, Algeria, and a regular service started from there to Canvey Island, UK. This service employed two 27,500 cubic metre capacity sisterships, Methane Princess and Methane Progress, the first two new ships constructed for LNG transportation. Together, these vessels were designed to perform about sixty round trips per year, bringing around 700,000 tonnes of liquid gas to the UK annually.

Rapid growth in the global LNG carrier fleet followed but, in the aftermath of two world energy crises in the 1970s, enlargement slowed and then partially reversed during the 1980s, before resuming over the next decade. Subsequently, strong expansion returned in the early 2000s.

Within the period of nine years from 2002 to 2010 mostly double-digit percentage fleet capacity increases were recorded, with growth averaging a remarkable 15.6 percent annually. Since then, in the past three years, increases tailed-off sharply. Nevertheless, over the entire period from the beginning of 2000 to the beginning of 2014, Clarksons Research figures show that the global LNG fleet’s capacity expanded more than four-fold, from 12.2 million cubic metres, to 55.3m cubic metres. And it is set to get much bigger.

During this year, the 386 ships in the world LNG carrier fleet at the beginning are due to be joined by many more. The result may be over 8 percent capacity growth in 2014, perhaps followed by over 7 percent in 2015. These estimates depend upon assumptions not only about newbuilding deliveries, but also about scrapping, although that influence seems likely to be fairly minor. The fleet is relatively young, mainly constructed within the past fifteen years, and most ships have long working lives, so demolition volumes probably will prove minimal. Higher newbuilding deliveries are implied by an extensive orderbook, resulting from a contacting surge in the past three years. At the beginning of this year orders at shipyards amounted to 17.4m cubic metres, approaching one-third of existing LNG fleet capacity.

LNG carriers are very costly to build, and have high operating costs, reflecting the sophisticated technology required. Natural gas, or methane, liquefies at an extremely low -161.5 degrees celsius temperature (reducing volume to 1/630th of the original), and therefore LNG must be kept below that figure. A tank system providing adequate insulation is expensive to install. Originally, the ships did not have refrigeration equipment: heavy insulation and a fast speed minimised boil-off, which was utilised for propulsion in steam turbine engines. In more recent years, ships with reliquefaction plant and diesel-electric or diesel engines appeared and have become standard, with most new vessels employing these power sources.

What explains the renewed popularity, for owners, of these expensive vessels? A standard large 160,000 cubic metre newbuilding LNG carrier currently costs $200 million, which is almost twice the $101 million price of a 320,000 deadweight tonnes VLCC. This magnitude of capital expenditure for one unit tends to limit investor participation. But recent signs have encouraged owners and operators. Slow fleet growth in the past three years, averaging just over 2 percent annually, is one influence. More importantly, there are distinct signs of accelerating LNG trade expansion over not only just a few years ahead, but probably many years ahead, as import demand around the world strengthens and new major export projects come on stream.

LNG trade set to race ahead
Over the past couple of years, global LNG trade has slackened. In 2011, after a strong upwards trend, it reached a record high, more than double the volume seen ten years earlier. The 2011 total was 240.8 million tonnes, according to figures compiled by the International Group of Liquefied Natural Gas Importers (IGLNGI). During the following twelve months a nearly 2 percent reduction was seen, followed by a minimal 0.3 percent increase to 236.9m tonnes in 2013. But resumed trade growth in the period ahead is widely expected, including an increase this year.

The attractions of natural gas are well known. Its environmental credentials as a clean energy source are especially prominent, in an era when reducing carbon emissions has become a policy priority for many countries. Compared with other hydrocarbons and alternatives – coal, oil, nuclear power, hydro-power and other renewables – gas is often seen as the most desirable and economically beneficial fuel. Global reserves are plentiful and expanding, more export sources are being developed, and relative pricing is often advantageous.

Natural gas is the fuel of choice for electricity generation in many countries, and for other industries. Its favourable technical characteristics, coupled with economic advantages, have resulted in its selection for new major power plants. Industrial processes elsewhere also consume gas, which can be used directly for commercial and household heating purposes.

These features seem set to ensure that future trade expansion is both vigorous and prolonged. Among optimistic views, a recent report published by the US Energy Information Administration suggested that another surge in global LNG trade may occur within the 2015 to 2025 period. Although natural gas trade is not entirely seaborne, as pipeline flows comprise a large part and these are set to increase, ship movements will greatly benefit from rising import demand around the world. Of particular significance for seaborne trade is that a major part of incremental volumes is likely to consist of output from several massive LNG export-oriented projects under development in Australia. The precise timing of additional export availability reflects the completion of liquefaction projects, while import capacity depends on regasification facilities.

Much attention is focused on the Asian region as the area where there is most potential for a strongly rising LNG import demand trend. In 2013 this region comprised 75 percent (178.0m tonnes) of world imports, with Europe (33.9m tonnes) comprising 14 percent and other importers together 11 percent, according to IGLNGI calculations. By far the largest individual importing country was Japan, with 88m tonnes, a massive 37 percent of the world total, followed by South Korea with 40m, a 17 percent share.

Japan’s current position, as dominant importer, has been enhanced by greater reliance on LNG in the aftermath of the earthquake and tsunami in spring 2011 and the associated Fukushima-Daiichi nuclear power station disaster. Consequent closure of all Japanese nuclear plants has boosted consumption of alternative fuels. LNG imports last year were 24 percent above the volume three years earlier. But potential for further expansion of LNG use is probably limited, especially if some nuclear plants are re-opened over the next few years.

Prospects for enlarged Asian imports are most evident in China and India. China’s LNG imports have almost doubled in the past three years, reaching 18.6m tonnes in 2013, while India’s rose by 45 percent to 13.1m during the same period. Further rapid growth in China seems assured amid strongly growing consumption and insufficient domestic gas resources, and despite additional pipeline capacity under development. One clear indication is several new LNG regasification terminals under construction in Chinese ports. Similar influences are visible in India.

The global exports scene currently features Qatar as the largest supplier, exporting 78m tonnes to world markets in 2013, a one-third share of the total. Other large exporters with 7-11 percent shares are Malaysia, Indonesia, Australia and Nigeria, accompanied by Algeria, Russia, Oman and Trinidad & Tobago with 4-6 percent shares. A dramatic upheaval is approaching, when seven projects in Australia could result in an estimated more than tripling of the country’s LNG exports by 2019. The biggest of these, the massive Gorgon project, is scheduled to start next year. These developments look set to propel Australia into the number one exporter position.

Shipments from the USA could also become a significant element, although export projections are surrounded by great uncertainty. Political decisions will be very influential. Until relatively recently, the USA’s main role in the LNG trades was that of an importer, with new LNG import facilities being opened in 2010 and 2011. But the ramping up of domestic shale gas production has been very rapid, Consequently, LNG imports have declined steeply from 8.2m tonnes in 2010, to under one-quarter of that total, 1.9m, in 2013.

Enhancing LNG’s maritime role
Enlarging LNG trade’s impact, within the maritime sphere, is the growing employment of, or intention to employ, a floating processing unit at one end or both ends of a voyage – the FLNG and FSRU mentioned earlier. In numerous importing countries, FSRUs have already started operating, providing economic advantages compared with alternative land-based regasification plants. Many more vessels of this type are on order.

The FLNG era is poised to begin soon, in spectacular fashion. Australia’s Browse project starting in 2017 will be one of the first entrants, deploying the Prelude, an FLNG vessel currently under construction in South Korea, which is estimated to cost $3 billion. This enormous unit, with a hull almost half a kilometre long, will have an LNG production capacity of 3.6m tonnes annually. Cargoes will be offloaded into conventional gas carriers for transportation to Asian export markets. The new FLNG is intended to remain in position off Australia’s north west coast for twenty five years.

Prominent characteristics of the global LNG shipping industry have been modified by several changes over the past decade, especially in the past few years. Perhaps most visibly, vessel employment arrangements altered. Employment was typically arranged on a long-term contract basis, for periods of twenty years or more, associated with specific gas production projects. In recent years a growing LNG volume has been available on the short-term market, amid rising trade and increasing diversity of trading patterns, with more exporters and importers participating.

This shift in emphasis has enabled a ‘spot’ and short-term freight market to develop and become established, attracting more attention from independent shipowners. Demand for transport capacity has been enhanced by a persisting LNG price differential between high-priced Asian markets, and other parts of the world where lower prices prevailed. With more cargoes being shipped from the Atlantic basin to Pacific destinations, voyage distances lengthened, adding to vessel demand.

Are there any clouds on the horizon for this promising shipping activity? One obvious possibility is that, with more cargo shipments not tied to long-term transportation contracts guaranteeing vessel employment, there is greater potential for over-capacity in the LNG carrier fleet to evolve. Another overshadowing factor is shale gas. If gas importing countries such as China are able to develop their domestic shale gas deposits quickly, on a large enough scale, import demand for LNG could be hit severely. Although such an outcome is certainly possible, signs currently suggest that in many countries shale gas is unlikely to be developed as quickly as it has been in the USA, for a variety of reasons: the huge challenges faced may result in slow, or very slow progress. LNG shipping market prosperity will benefit if this perception proves realistic,

Richard Scott
Visiting Lecturer, Greenwich Maritime Institute and MD, Bulk Shipping Analysis

China’s rising energy imports: boosting global seaborne trade

Shipowners around the world have greatly benefited from China’s huge appetite for energy commodity imports, often involving long-distance voyages, over the past decade. Amid rapid expansion of economic activity and industrial output, China needed to supplement domestic energy resources with imported supplies, on an ever-increasing scale.

An optimistic view points to this strong upwards trend continuing. But how realistic is that prospect, in the light of accumulating signs indicating slowing economic growth in the years ahead? And what will be the impact of plans to enlarge the role of China-owned ships within these trades?  Image

Seaborne imports of coal, oil and gas into China, the main energy commodities received, are estimated to have reached about 620 million tonnes in 2013, based on calculations by Clarksons Research and Bulk Shipping Analysis. This massive total, comprising about 15 percent of all world seaborne trade in these categories, resulted from fast expansion in the past ten years. From about 130mt in 2003, the total almost doubled by 2008 and then more than doubled in the next five years. The annual increase last year apparently was about 9 percent.

Among the commodities, coal has been the star performer. China’s imports by sea of steam coal (used mainly in power stations but also in other industries) and coking coal (used in the steel industry) exceeded 300mt last year, growing from a small 10mt ten years earlier. Steam grades currently comprise roughly three-quarters of the coal volume. Seaborne imports of crude oil and oil products (refined oil) are almost as large, reaching over 290mt in 2013, more than doubling over the decade. Gas imports are much smaller, but growing quickly. The largest category of gas imported by sea – liquefied natural gas (LNG) – rose from nil a decade ago, to reach about 18mt last year. Imports of liquefied petroleum gas (LPG) total around 3-4mt annually.

A vast energy market

With a population of 1.35 billion people, the world’s most populous country, and a very rapidly growing and industrialising economy over many years, China’s demand for energy has risen enormously. Among the different contributors, coal is dominant, supplying about two-thirds. Oil is the second largest, at under one-fifth. The remainder is comprised of mainly hydro-power and natural gas, accompanied by nuclear power and renewable sources.

The largest portion of energy consumption consists of power stations generating electricity. These power plants are predominantly coal-fired, but alternative fuels used are gas and uranium (nuclear generation), supplemented by hydro-electricity. Generation from renewables, especially wind, is becoming much more significant. Several other industries also use steam coal. In the steel industry mills based on the blast furnace method producing pig iron, for conversion into steel, consume coking coal. The main contribution of oil is within the transport fuel market – road vehicles, aircraft and ships.

A large part of China’s market is supplied by domestic energy producers – coal mines, and oil and gas fields. Home production of the three fuels has increased over the past decade. But demand from consumers rose more rapidly than producers were able to raise their output. Rising imports trends resulted.

Coal is produced on a gigantic scale in China, the world’s largest producer (as well as consumer) of this energy source. Last year’s output was about 3.7 billion tonnes and although only slightly above the previous year’s figure, it was double that seen ten years earlier. The country’s remarkable economic development has been underpinned by coal, but resulting pollution has led the government to re-evaluate its contribution and to encourage use of alternative, cleaner, fuels.

Domestic crude oil production has also risen, reaching an estimated 213mt in 2013, about 25 percent higher than the volume seen a decade earlier. Most of China’s output is derived from mature fields where it has proved difficult to improve yields. Elsewhere, both onshore and offshore in coastal waters, extra oil production is evolving positively. Currently, the natural gas production sector is much smaller, although output has more than tripled in the past ten years, reaching an estimated 115 billion cubic metres in 2013. This upwards trend is being strengthened by the official policy to promote gas consumption. A small but growing contribution is obtained from shale gas deposits.

Adding to the positive impact on coal import demand, of a shortfall between the amount consumed and the amount produced, were more specific influences. Coal movements over long distances (from mines located mainly in the north, to consuming areas in the south or to the coast for onward transhipment) have been constrained by rail transport capacity and freight charges. Imports became even more competitive when international prices and the delivered cost (including ocean freight) was below domestic prices. Limited volumes, in domestic mines, of the high-grade coking coal used by the steel industry also boosted imports. Conversely, rising land movements from Mongolia were partially offsetting.

Huge imports of oil, gas and coal

China’s need to secure increasingly large volumes of the main energy commodities, from foreign suppliers, has been a great advantage for the global shipping industry. Employment opportunities for bulk carriers, tankers and gas carriers have mushroomed so much that, in all these trades, Chinese import demand is one of the principal influences and a major focus of attention for shipowners and operators.

A key question, therefore, arises. Will this favourable pattern persist, and to what extent, not only in the immediate future but further ahead? Given that, arguably, there are no other signs of growing import demand for these energy commodities around the world of a similar magnitude to that of China, the significance of the answer is crucial for shipping markets. What we can, perhaps, foresee is a somewhat mixed picture evolving, with strong positive elements.

Assumptions about China’s economic growth, and the pattern of its components, are a vital aspect. In both 2012 and 2013, gross domestic product (GDP) increased at a 7.7 percent annual rate, compared with an average 10 percent growth in the previous twelve years. An extended slowing trend is almost universally expected by forecasters, but opinions vary about the pace.    

Prospects for seaborne oil imports are widely seen as promising. Consumption of oil in China is growing rapidly, especially in the transportation sector where surging road vehicle numbers are boosting demand for motor gasoline and diesel oil, a trend which is expected to continue. In a recent report Australia’s Bureau of Resources and Energy Economics (BREE) emphasised that increasing household incomes are likely to enable a rising proportion of Chinese families to purchase cars, substantially adding to fuel usage.  However, a partial offset is envisaged: steps being taken to lower the economy’s energy-intensity by improving the efficiency of energy use, and also by encouraging consumption of alternative fuels.

Expansion of oil refining capacity, at coastal locations, is another clear sign pointing to strongly advancing seaborne crude oil imports. Further large capacity additions are scheduled during 2014, following last year’s increase. Moreover, China is implementing plans to substantially expand both strategic (state-owned) and commercial crude oil reserves, and new strategic inventory tankage is opening this year. But a proportion of the incremental quantities required will be derived from domestic production. And imports are not entirely delivered by ship: pipeline connections with adjacent countries Kazakhstan and Russia are alternative, land-based routes. Increased refinery capacity may both restrict imports of refined oil products and boost exports.           

The outlook for seaborne imports of gas also seems bright. China’s natural gas consumption is set to grow vigorously, with added support from the government’s intention to encourage usage in preference to other hydrocarbons. As well as increasing domestic production, pipelines bringing gas from neighbouring countries, including the huge-capacity pipeline linking China with Myanmar which opened in 2013, will contribute large supplies. But nine LNG terminals at ports are already operating, and a further five are under construction, adding justification for expecting a strong upwards trend in seaborne imports, as emphasised in a recent report published by the US Energy Information Administration.

Overshadowing this view is shale gas. If China’s known gigantic reserves can be developed to ramp up production quickly on a colossal scale, then all other energy consumption and seaborne import predictions for fuels may be proved invalid. This scenario seems unlikely to happen in the near or medium-term future. Exploitation of shale gas is problematical in China. The geology is much more complicated than in the USA, where shale gas has been developed rapidly, requiring the drilling of many more wells. Expertise and equipment on the scale required for truly massive exploration and production could remain limited in China for some time, while the large water supplies also needed are not always available. Moreover, the essential pipeline connections for distributing the gas nationwide are not yet in place.

The prognostications for seaborne coal imports into China are more hazy. Some forecasts a few years ago indicated a strong expansionary trend continuing for many years. That view has proved correct so far, but there are now much greater uncertainties surrounding the outlook. The Chinese government’s intensifying emphasis on shifting energy consumption towards cleaner fuels is prominent, amid a slowing economy.  This policy focus could reduce the large volumes (60mt in 2013) of low-grade, highly polluting lignite which is imported mainly from Indonesia. Also, an intention to make the economy’s capital investment spending and infrastructure-building a lower priority, implies that the heavy industry with high energy usage supplying materials such as steel will not be growing as quickly as seen in the past.

These prospective changes have implications for power stations, steel mills and other industries using coal. Although the balance of factors still, arguably, suggests that further growth in China’s seaborne coal import demand is a realistic idea for the years ahead as a trend, the pattern of annual progress may not be steady and could be subject to large variations.                  

Another feature of shipping demand related to energy commodity imports into China is the trade distances involved. Currently, large cargo volumes are seen on long-haul routes, but there are many examples of short-haul routes as well. Middle East countries together are the largest oil supplier, while Qatar alone supplies a high proportion of LNG imported. Seaborne crude oil imports from West Africa (especially Angola), Venezuela and Russia are prominent. Gas is imported also from Australia, Indonesia, Malaysia and other countries. Within the coal segment, Australia and Indonesia are the biggest suppliers, accompanied by Russia, Vietnam, South Africa and others. Any changes in these patterns affect tonne-miles and required shipping capacity.

Promising signs for shipping

This analysis suggests that the clearest indications of future growth, in China’s imports of energy commodities, during 2014 and probably for an extended period, are visible within the crude oil and LNG trades. These commodity purchases seem set to continue increasing strongly despite an envisaged slowing of the economy’s growth rate. There is some justification also for optimism about further coal imports expansion, but the reasoning is more tenuous, especially given the government’s focus on restraining industrial pollution as a means of improving the environment and air quality.

Finally, how much of this increased cargo volume will be carried by China-owned tonnage? Many additional bulk carriers, tankers and gas carriers are joining the fleets of shipowners based in China. Orders for newbuilding vessels listed by Clarksons Research, mostly scheduled for delivery by the end of 2016, amount to a large volume. Among these, Chinese shipowners at the beginning of March this year were awaiting delivery of 38 capesize bulk carriers totalling 8m dwt; 27 VLCC (very large crude carrier) tankers totalling 8.2m dwt; and 6 VLGCs (very large gas carriers) totalling 1m cubic metres capacity. Numerous other ships were on order.

The China-owned share of the global fleet participating in energy commodity import trades has been growing strongly, and seems set to continue enlarging. Nevertheless, shipowners of other nationalities probably will be carrying larger quantities of expanding trade volumes, even if their percentage share is diminishing.

 Richard Scott

China Maritime Centre, GMI and MD, Bulk Shipping Analysis

Are shipping investors becoming too bullish?

Shipping investment is returning to favour. The amount of money invested in new tankers, bulk carriers and container ships last year was dramatically higher than seen in the previous twelve months. Shipping investors perceived a period of better markets approaching (if still some way off), while the drastic reduction in shipbuilders’ prices for new buildings seen over the past few years greatly increased the attractions of ordering new tonnage, especially more economical tonnage. But will these huge investments prove well-timed? Accurately predicting the cycle has always been a hazardous exercise.

The statistics for new building orders placed at world shipyards in 2013 are impressive. Bulk carriers led the pack: 937 vessels with a capacity of 80 million deadweight tonnes were ordered, one-sixth more than the total for the previous two years together. Tanker contracts, 376 ships of 34m dwt, exceeded by two-fifths the previous two years’ volume. Container ship orders, by contrast, at 223 ships totalling 21m dwt, were one-fifth lower based on the same comparison, but this amount was still far higher than seen in the immediately preceding year. These calculations, based on provisional figures compiled by Clarksons Research, demonstrate the massive scale of renewed enthusiasm for capital investment spending within the industry.

Despite persistent worries about where investment funds would be obtained, substantial new money became available. Stories about the traditional providers of finance, the shipping banks, withdrawing from the market remained at the forefront, but other investors stepped in. As the incentives appeared to improve, amid signs of a bottoming-out of the long shipping recession, private equity funds, hedge funds and various alternative sources gained prominence.

Combined with shipowners’ internally generated funds, the external sources were sufficient to enable an estimated $104 billion to be invested in new buildings of all types in 2013, a 16 percent increase from the previous year. Investment in tankers, bulk carriers and container ships last year was more than double the value seen in the preceding twelve months. By contrast, investment in the now very large offshore sector saw a huge reduction, limiting growth in the grand total.

Trade growth incentives

Looking at how trade has been growing in the past few years, shipping investors can be forgiven for thinking positively. Global seaborne trade in all cargo types, during the period of four years from 2010 to 2013 (including an estimate for last year), averaged remarkably strong 5.5 percent growth annually. This performance is somewhat exaggerated by including the ‘bounceback’ year of 2010, when a recovery took place from the effects of the world financial crisis and ensuing severe global recession. Nevertheless, it is still a very creditable achievement amid lacklustre growth in the world economy.

A glance at seaborne trade growth rates over the past three decades reveals how unusual it is to find a phase of similar length and strength. There was only one: 2003 to 2006, within the ‘boom’ period, when annual increases over four years averaged 5.4 percent. Given that both ‘super growth’ periods happened within the new millennium, and that prospects for more trade expansion in the future are clearly visible, it is not altogether surprising that eagerness to invest in new shipping capacity is evident.

In previous cycles, a significant period of more robust trade expansion and vessel demand was often reflected in high freight markets, until vessel supply caught up and overtook the demand trend when additional newbuildings became available. This pattern has not occurred in the past few years, at least not on a sustainable basis.

The explanation is fairly straightforward. After the freight market boom ended in 2008, surplus transport capacity was created by enormous fleet expansion, caused by what proved to be excessive ordering of new ships while the boom was still in progress. This over-capacity has overwhelmed even a sustained robust upwards trend in seaborne trade movements in the past few years. Mainly subdued freight markets resulted, although there have been temporarily stronger episodes. But the excess capacity is being reduced, and demand-supply gaps are closing or likely to begin closing soon, hence improving the prospects for freight market returns and, in turn, improving the investment outlook.

Two charts in the latest monthly report of shipbroking company Platou clearly demonstrate how much surplus capacity has occurred in the global tanker and bulk carrier fleets during recent years. These charts provide a general view, because circumstances vary among different sizes and types of tonnage within the sectors. For tankers, fleet utilisation is shown as declining from around 90 percent at the 2008 peak, to nearer 80 percent last year, although towards year end there were signs of an improvement emerging. For bulk carriers, the decline was more dramatic, from close to full 100 percent fleet utilisation in 2007-08, to around 85 percent in 2013, followed similarly by signs of a distinct upturn getting underway later in the year.

More enjoyable times ahead?

Bulk carriers have re-emerged as a favourite for shipping investors. The rehabilitation of this sector’s attractions last year has raised some eyebrows. It has suggested the possibility that renewed enthusiasm, and resulting new capacity ordered for delivery in the next couple of years, could delay a sustainable freight market recovery.

A clear example of how such a setback can be triggered is provided by events in 2010. At the beginning of that year, there was still a colossal volume of orders for bulk carrier newbuildings at shipyards around the world, totalling 298m dwt. This quantity, mostly scheduled for delivery over the following two or three years, was equivalent to 65 percent of the existing global bulk carrier fleet, implying massive capacity expansion ahead. During 2010, shipping investors’ optimism about a freight market recovery resulted in a further huge 103m dwt of orders being placed, raising the total order book even higher despite its already vast size.

The consequences of this questionable eagerness are still being observed today. For individual investors, there are often compelling reasons justifying the purchase of new tonnage, but if too many have the same idea at the same time the results can be unpleasant.

So what are the main factors which will determine whether the large investments seen over the past twelve months and previously, in tankers, bulk carriers and container ships, will prove worthwhile in the years ahead? At the beginning of 2014, according to Clarksons figures, new tankers on order at shipyards were equivalent to 13 percent of the existing world tanker fleet. Much higher percentages were evident elsewhere. In the container ship sector, the equivalent of 20 percent of existing tonnage was on order, and in the bulk carrier sector the figure was similar at 21 percent. Most of the new tonnage is scheduled for delivery this year and next year. These percentages imply considerable fleet expansion.

On the ship demand side of the picture, trade growth could absorb the new capacity. Currently, there are clear signs pointing to global seaborne trade growing solidly over the next few years, although prospects for crude oil trade to increase are limited. Much depends on the world economy’s performance: there is some anxiety about whether China, the main driver of growth in many market segments, will continue to perform as strongly as seen in recent years. Changes in geographical trade patterns, affecting voyage distances and tonne-miles (a more accurate measure of shipping demand), also will be influential.

On the ship supply side of the picture, newbuildings entering the fleet will be partly offset by scrapping (recycling) old or uneconomic vessels. The extent of this offset is always difficult to estimate. Many new ships are specifically designed to cut bunker fuel consumption: these could accelerate replacement of older tonnage. Then there is the productivity factor. Large proportions of the existing fleets are ‘slow steaming’ to reduce fuel costs, amid subdued markets and vessel earnings. The annual transport capacity provided by these ships could expand if, as a result of improving markets, slow steaming is reduced, enabling ships to perform more voyages in the same time period.

It is a conundrum, a large one! In the global shipping business, great uncertainties are not abnormal, and are what experienced shipowners are quite familiar with. Whether all the newer players are as familiar with the imponderables remains to be seen. Recent investments in new ships certainly have the potential for proving highly lucrative, if changes in market conditions greatly reduce over-capacity. If that does not happen the results may be much less palatable. It is not an industry for the risk-averse, and this characteristic explains why the shipping business is so exciting for investors.


Richard Scott

Visiting lecturer, Greenwich Maritime Institute and MD, Bulk Shipping Analysis

 

Voyages of Separation: Modern Container Ships and Seafarers

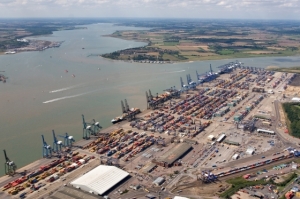
A visit to a jetty at the little port of Harwich on England’s east coast, facing the North Sea, is a good place to get a glimpse of the modern global shipping industry’s enormous scale. From this vantage point the much bigger Felixstowe port on the opposite bank of the River Orwell can be seen in panoramic view in all its glory: bustling activity along the waterfront with a long line of huge container ships loading and discharging.

RS Blog 1

Even for maritime professionals well-acquainted with this shipping sector, it is an impressive sight, underlining the vastness of international seaborne trade in containerised goods of all sorts and varieties. But only a small part of the population sees this vital maritime activity at Felixstowe or elsewhere in ports around the world and, among those who do, many will be blissfully unaware of its true significance. Mostly these ships, and indeed other vessel types, and the ports which serve them, are well hidden from public view in remote locations.

That is why a new book by Rose George published last year, entitled ‘Deep Sea and Foreign Going’, provides a valuable contribution to understanding the importance of this obscured-from-view industry. The author’s voyage on a container ship from the UK to Asia is the setting. In particular, the narrative offers a fascinating insight into the working lives of the people who make it happen, the seafarers.

Clearly described is the difficult and, at times, potentially very dangerous environment in which seafarers not only work but totally exist for periods of many months while employed on long-distance voyages. There is no escape from the working environment while a ship is at sea (virtually all the time). These circumstances are not comprehended by most users of the goods which the ships transport. Many consumers have no idea how electrical or electronic devices, for instance, get to the shops from the manufacturers in China, Korea or other origins. Some think it all arrives by air freight. There is even less understanding of what seafarers have to encounter, and their separation indeed isolation from the civilised world, living in a small and sometimes not very sociable closed community, while serving at sea for extended periods.

Despite these features, Rose George acknowledges on page 9 that “seafaring can be a good life”. Another acknowledgement is that “most ship owners operate decent ships that are safe, and pay their crews properly” (page 86). On the other hand, some owners hide behind a flag of the open registry variety and cut corners, which can lead to disasters for both ship and crew. And, disturbingly, in concluding comments on page 265, the author quotes the master of the container ship on which she travelled as saying that the crew are “mere chattels, a human resource, dispensible non-entities”. This opinion is not exactly a ringing endorsement of comfortable relationships between managements and seafarers.

It is a highly readable book, quite gripping in parts, written in an easy-going style. Ignoring some lengthy deviation about a ship rescue in the second world war, and whale preservation in the northeastern USA, it serves a useful purpose. But as an educational exercise, for the general public, presumably the author’s aim as a piece of ‘investigative journalism’, much more could have been said about the global container shipping industry. A few short paragraphs of miscellaneous and not especially helpful industry statistics, as background, are insufficient to provide meaningful context.

One essential fact, which could have been included as contextual information for the aspects identified during the voyage, is that container ships now comprise 13 percent of the world fleet of all cargo vessels, a fleet including many other important ship types. Another is that container ships numbered 5,106 at the end of 2012, with a capacity of 16.2 million teu (twenty foot equivalent units, the standard measurement), based on data from Clarksons Research. Container ship fleet growth over the preceding decade was 168 percent and capacity continues to rise. And increasing ship sizes – 18,000 teu leviathans are joining the fleet, compared with vessels only half that size which were the norm only a few years ago – are a feature of progress, ensuring more economical transportation.

Another storyline emphasis might have been the services these ships provide for global manufacturing industry, how container services are organised and why they are so effective and efficient. World seaborne containerised goods shipments are estimated to total over 1.5 billion tonnes per year currently, after almost doubling during the past decade. Ocean freight cost is generally a low proportion of most products’ value. The impact on, and advantages for, the globalisation process are apparent. Many countries have been integrated into the global trading system when previously they were on the fringes, if participating at all.

None of the foregoing maritime achievements are satisfactorily set out in ‘Deep Sea and Foreign Going’. Arguably, such a preliminary discussion is required for a balanced view to be offered. Nevertheless, the book certainly has great merit in opening eyes to the stark realities of seafarers’ lifestyles and, frequently, the lack of attention paid to this noble profession. Many spectators standing on the remote Essex jetty watching the impressive ships coming and going could gain a useful perspective by reading it.

Richard Scott, Visiting Lecturer, Greenwich Maritime Institute and MD, Bulk Shipping Analysis
Valuable UNCTAD Review Analyses Maritime Matters

In a characteristically thorough and perceptive analysis the ‘Review of Maritime Transport 2013’, just published by UNCTAD (United Nations Conference on Trade and Development), throws light on most of the main issues currently faced by maritime activities around the world. This annual publication, which started life in 1968, has achieved a solid reputation as a first point of reference for many people about industry trends and possible future events. Its utility is greatly enhanced by ready availability free of charge on the organisation’s website.

Among topics selected for special attention in the latest edition, the Review focuses on how the global shipping industry will be financed in future years. Where will new money come from? The partial withdrawal of the banking sector as a traditional source of finance has left a large gap needing to be filled. Private equity funds have stepped into this void, and are making an increasingly noticeable impact. Although shipowning previously had not been the most obvious private equity target (because the volatility and downside risks of the shipping sector were unpalatable for them), involvement recently seemed a much more attractive proposition.

The Review’s authors conclude that “the role of private equity funds appears fundamental for the growth of the sector and could affect its development in several ways, including through the consolidation and vertical integration of transport services.” But the authors draw attention to a notable feature: many private equity investors are not long term players. Investments are made by private equity at what they consider to be at or near the bottom of the market. Involvement is often for a temporary period (which may be several years) until the market rebounds, enabling the selling or flotation of investments at a sizeable profit.

In another section focusing on selected emerging trends affecting international shipping, the UNCTAD Review highlights fuel costs and slow steaming, lower-sulphur fuels and air emissions, and innovative ship designs and eco-ships. These separate topics are, of course, linked and feature in much discussion within the maritime industries. They emerge against a background of climate change and its implications. As noted in the report “of all the prevailing challenges…the interconnected issues of energy security and costs, climate change and environmental sustainability are perhaps the most unsettling.” Nevertheless, despite these problems and difficulties, on a more positive note opportunities for the shipping industry are arising from a number of trends which could strengthen or enhance shipping services.

What will be of especial value to many readers of the Review is its comprehensive regular analysis of the fundamental influences affecting the maritime industry, contained in three chapters – developments in international seaborne trade; structure, ownership and registration of the world fleet; and freight rates and maritime transport costs. This analysis is accompanied by detailed statistical tables. There is also a chapter about port developments and another about legal issues and regulatory developments. A discussion about access to maritime transport for landlocked countries is included as well.

One event emphasised, which occurred in 2012, is the turn of the largest shipbuilding cycle in recorded history. Given the chronic overcapacity which has been a feature of many shipping sectors for some time, and the consequent low freight rates prevailing, this is highly significant. For the first time since the beginning of the new millennium, the tonnage of new vessels of all types delivered from world shipyards in 2012 was lower than seen in the preceding twelve months. Every previous year had seen an increased volume.

The resulting capacity expansion over the decade, sometimes very rapid, has seen the world fleet of commercial sea-going ships more than double since 2001, reaching 1.63 billion deadweight tonnes in January 2013. But, reflecting newbuilding deliveries greatly outpacing additional orders placed, the world orderbook for new vessels at shipyards has declined dramatically during the past few years. After an interval, newbuilding deliveries, as highlighted in the Review, are now falling as well. This changing picture, along with other influences including ship recycling and of course further trade growth, can be expected to assist in correcting the excess transport capacity still existing.

Meanwhile global seaborne trade has been growing at a healthy, or what might be described even as a remarkable pace (amid economic setbacks in various countries), in the past few years. The UNCTAD Review emphasises how trade performed better than the world economy in 2012, expanding by an estimated 4.3 percent, nearly the same rate as in the previous year. A volume of 9.2 billion tonnes of goods was loaded in ports worldwide last year, resulting from growth driven in particular by more domestic demand from China, as well as increased intra-Asian and South-South trade.

China’s contribution to all this trade growth has been immense. Calculations based on figures which are not contained in the Review underline the point. These figures compiled by Bulk Shipping Analysis suggest that in the period of ten years between 2002 and 2012, expansion of China’s imports of all cargo types contributed around 46 percent of the entire world increase. For dry bulk commodities, comprising the largest part (over two-fifths) of all world cargo movements, the proportion of growth contributed by China is higher at 63 percent. The Review highlights as a cautionary note the great dependence of dry bulk trade expansion on Asian (and particularly Chinese) demand, and on only two commodities, iron ore and coal.

Looking at aspects of the global merchant shipping fleet, a table showing the world’s 35 largest national fleets by ownership always makes fascinating reading. As in previous years the top four remain the same: Greece, Japan, Germany and China. Country of ownership of a vessel is defined as the place where true controlling interest (the parent company) is located. Significantly, among the top four, China rose from fourth to third position during 2012 so that, at the beginning of this year its fleet of 190.1m deadweight tonnes formed 12 percent of the world total. One year earlier, the Chinese fleet had been 9 percent of the global total, rising from 5-6 percent in the early 2000s. Consequently China is rapidly approaching Greece’s 15 percent and Japan’s 14 percent. Just over two-thirds of China-owned tonnage is registered under foreign flags. When will China’s fleet become the world’s largest? Probably quite soon, although the Review does not say so.

The UNCTAD Review of Maritime Transport is keenly awaited by many who benefit from its extensive coverage of the maritime scene. The updated statistics are very valuable. And its discussion of specific currently prominent aspects (‘hot topics’) justifies anticipation. The latest 2013 edition does not disappoint.


Richard Scott

Visiting Lecturer, Greenwich Maritime Institute and MD, Bulk Shipping Analysis
 

A Magnificent Transformation: World Shipping 50 Years Ago and Today

It began to take shape fifty years ago. Parts of the outline of the highly efficient global merchant shipping industry we see today started to become visible in the early 1960s. The transformation process was already well under way by then, in the tanker sector. But back in 1963 much of the world’s shipping system, consisting of cargo liner services and dry cargo tramp trades, was not functioning well. Dramatic changes were beginning, however, which would revolutionise the dynamics over the next decade and beyond.

The preceding revolution, the changeover from sail to steam propulsion, had greatly improved performance in the shipping industry. This fundamental technological change had increased capacity and enabled scheduled services to operate, but some inefficient aspects continued. In many trades cargo-handling in ports was said, jokingly, to have remained unchanged since the time of the Phoenicians, except that powered winches had replaced muscle-power. In the next revolution, from the 1960s onwards, old methods and traditions would be swept away by new technology and new working practices.

Industry characteristics and economics were studied in the early sixties by ambitious young men, working in London shipping offices, who enrolled for the shipping certificate course at the City of London College (in this era few women aspired to senior positions in the industry, which was male dominated). The course involved two years of evening classes. These keen students learned that the world fleet of ships at that time was dominated by liners (cargo and passenger), tramps (dry cargo) and specialised ships, including tankers.

Ship 1


Cargo liners were versatile, multi-deck ships with installed cargo-handling gear, carrying mostly manufactured goods, often accompanied by refrigerated products, together with some bulk cargo parcels. They operated on regular scheduled services. Tramps (dry cargo), available on the charter market, usually carried full shiploads of bulk commodities. Many of these tramps were similar, in size and specification, to cargo liners and their role was often interchangeable between the sectors. Tankers mainly transported oil and oil products. During the early sixties, two changes were prominent. Bulk carriers, including ore carriers and dual-purpose combined carriers (able to carry either oil or dry bulk cargo), were coming in strongly, and passenger liners (operating on regular routes) were going out.

Fifty years ago many ships spent a large proportion of their working lives stationary in port. In the cargo liner trades especially, cargo handling – loading and discharging – was often slow, or very slow, caused by labour-intensive methods. This sluggish performance frequently was exacerbated by poor labour relations with dock workers. Consequently, a huge global fleet of ships was chronically under-utilised. Expensive, sophisticated cargo liners could be in port for up to 60 per cent of available time for transport movements (equivalent to 200 or more days annually) and much of that was idle time, when no cargo was being handled. Profitability suffered heavily, and the system struggled to perform adequately. A more efficient service was needed to cope with fast trade expansion and the solution was containerisation, which developed quickly from the late-1960s onwards.

Containerisation proceeded apace through the 1970s and 1980s, and was truly a revolutionary upheaval, enabling manufactured goods to be transported around the world rapidly, securely and cheaply. Cargo liner trades became integrated into a through-transport system providing a door-to-door service for manufacturers, a new way of organising transport involving vast capital investment in ships, ports and cargo-handling equipment. This reconfiguration hastened and greatly assisted the world’s transition to a globalised economy, with its extended supply chains, as we know it today.

In other shipping sectors, bulk (dry and wet) and specialised trades, developments were also dramatic, although not quite so revolutionary. But notable changes greatly enhanced efficiency and provided more economical transport. In a large number of international trades much larger ships of improved designs were utilised. Different types of specialised vessel were introduced. Coupled with high speed shore-based cargo loading and discharging equipment, this amounted to a transformation.

Over the past five decades world seaborne trade growth has been astounding. Global seaborne trade of all types totalled 1.35 billion tonnes in 1963, according to UNCTAD statistics, of which 53 percent was liquids, mostly oil (tanker cargoes). The 2013 figure, based on calculations by shipping information providers Clarksons, could be 9.9bn. This total represents a more than seven-fold expansion over the fifty year period, having already reached an estimated 9.5bn last year, of which oil cargoes comprised 29 percent.

Another aspect is longer voyage distances in numerous trades. More remote supply sources for commodities and other goods were located and became economical to use, while globalisation and reduced transport costs altered geographical trade patterns. Tonne-miles, the standard measure of shipping demand because it reflects both cargo volume and voyage distance, was further boosted. A great enlargement of carrying capacity was required.

Shipowners responded to this requirement with huge investment in new tonnage, continuously expanding the global fleet of ships. Measured in gross tons, the world fleet of all types of merchant vessel in mid-1963 totalled 145.9 million GT, comprising 39,571 ships, according to Lloyd’s Register statistics. Fifty years later the mid-2013 fleet, based on Clarksons data, was 1,114.8m GT, consisting of 85,642 ships. This growth, over seven-fold, was similar to the trade volume percentage increase. But the productivity of the fleet had also improved. More specifically, a typical ship’s annual carrying capacity, as distinct from the single cargo capacity measured by vessel tonnage, had risen. Higher speeds at sea, less time spent in port, coupled with enhanced operational efficiency was instrumental in ensuring that each ton of ship’s capacity carried more cargo in a typical year. Another feature accompanying fleet tonnage growth was the 253 percent rise in the average ship size, from 3700 GT in 1963, to 13000 GT in 2013.

Currently, in the early 2010s, the world fleet of ships meeting the needs of cargo movements is comprised of three main sectors. Today’s students, such as those pursuing post-graduate maritime studies at Greenwich Maritime Institute, London are well aware that bulk carriers, tankers and container ships dominate. These vessels are accompanied by what has become a very large group of special purpose ships, such as liquefied gas carriers and car carriers. A prominent feature in many trades has been the great increase in the size of vessels typically employed, demonstrating advantages to be gained from economies of scale, amid pressure to reduce the unit cost of providing services.

From these brief highlights we can see that a fascinating and impressive period of progress has evolved in the global shipping industry, during the past 50 years. World seaborne trade has expanded enormously. The fleet of cargo-carrying ships, of various types and varieties, has been required to tackle an ever more challenging task, and has done so pretty effectively. Sometimes though, fleet growth in various sectors has been far too rapid, as investors collectively misjudged – always a difficult judgement – or ignored the shipping market cycle. What is abundantly clear is that great improvements have been made in the efficiency and sophistication of the sea transport system, restraining costs and freight rates and contributing massively to the globalisation era.

Richard Scott, GMI visiting lecturer and MD, Bulk Shipping Analysis

Conference Programme – China’s Growth as a Maritime Power: Global Sustainability

Slide1

We are now accepting bookings for this conference which will be hosted by the China Maritime Centre, Greenwich Maritime Institute and held at the University of Greenwich on Tuesday 10th September 2013.

Topics will include the following maritime dimensions:

China’s Ocean Shipping
Governing Marine Protected Areas
Maritime Labour Convention
China’s Global Seaborne Trade
Seafarer Fatigue
Green Ship Recycling

Please click here for a copy of the full draft programme.Programme Draft

Delegate fees include a delegate pack, attendance at all presentations, lunch and refreshments throughout the day plus a post-conference drinks reception.

To make an online booking please visit the following website: www.eventbrite.co.uk/event/6943445031